Last week the NRL noted that there would be a “crackdown” on deliberate infringements on early tackles that lead to set restarts, as it has become more obvious that teams are gaming them for reasons that myself and many others have mentioned before. Basically, it comes down to field position, as giving away one or two extra tackles is far outweighed by conceding an extra 20-30 metres down field as well as a fresh set of six.
What was the result of this set restart “crackdown”? Fewer penalties than Round 8 and slightly more set restarts. Not a lot of changes at first glance.
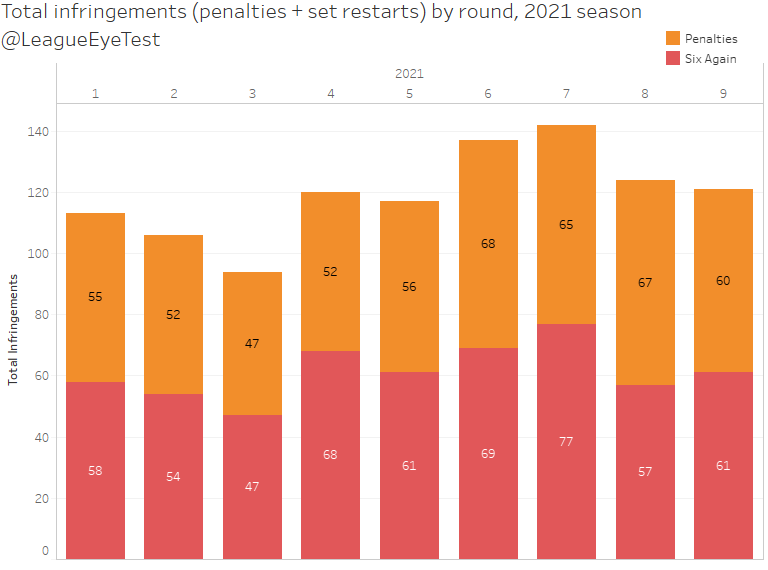
When you look at them broken down by half, a few variations can be seen. Penalties in the first half were identical to Round 8 and right near the year-to-date average. Second half penalties though were down by nearly one full penalty, and the lowest since Round 4.
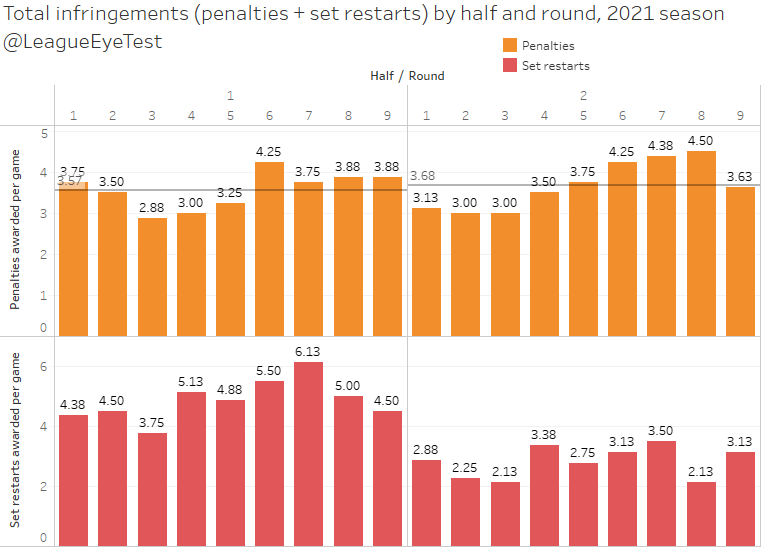
Where it gets interesting is that first half set restarts were also down, at just 4.5 per first 40 minutes, also the lowest since Round 4. Not only did we have fewer penalties, but we also had fewer set restarts in the opening period. As mentioned before second half penalties were down by nearly 1.0, which looks to be offset but the increase in second half resets of 1.0, which makes perfect sense. Infractions that were being called penalties in previous rounds were being given as set restarts.
Back to the first half decrease, there are a number of reasons this could be happening, ranging from teams being wary of the crackdown and behaving themselves (unlikely) and referees not calling as many first half restarts (more likely). As mentioned every week, I’m just using publicly available data, and the larger dataset the NRL and clubs have may show something about which tackles restarts were being conceded on, but for now this is the best we can use for analysis.
There’s also the number of one side games resulting in less ball in play, since you can’t concede a penalty or set restart if watching someone take a conversion. It doesn’t look like that had an affect as the rate of these violations being called was constant with previous rounds.
One of the other metrics I look at to gauge how they’re occuring is the number of play the balls per total infringement. Below is that metric broken down by halves.
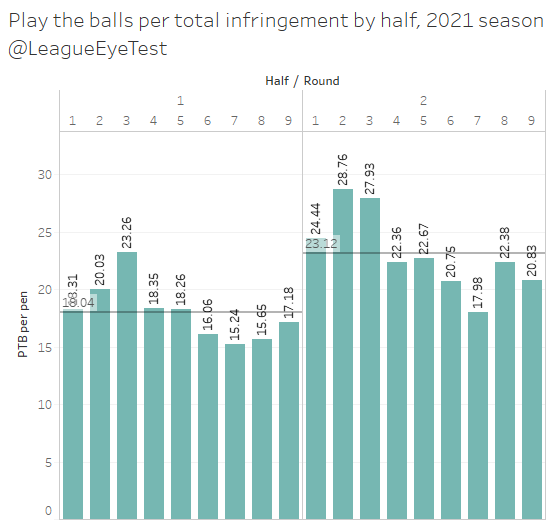
Overall, it’s about one penalty or set restart every 20 play the balls, or roughly once every three sets of six. Round 9 was one every 18.8 play the balls, right around the average. And by half it was about the same as well – right on the first half average of 18 and slightly under the second half average of 23.
In the end it seems like the set restart “crackdown” this week was a bit of a nothingburger. It was significantly overshadowed by the NRL’s unsafe working environment, which is something that absolutely needs a “crackdown”.
Team breakdown of set restarts and penalties
One of the more common requests I get through the Eye Test social media accounts is which teams are giving up or receiving the most set restarts. The reason for this seems to be that the NRL and Fox Sports (which I use as they’re the NRL Supercoach currency) don’t have them included on either of the stats pages. That’s not overly surprising as it took about six rounds for the NRL to even include them on their match stats pages.
Moving on, here’s the breakdown of set restarts awarded by team for the first nine rounds of the competition, split by halves. First halves are in blue, second halves are in orange with a total number at the end of each row.
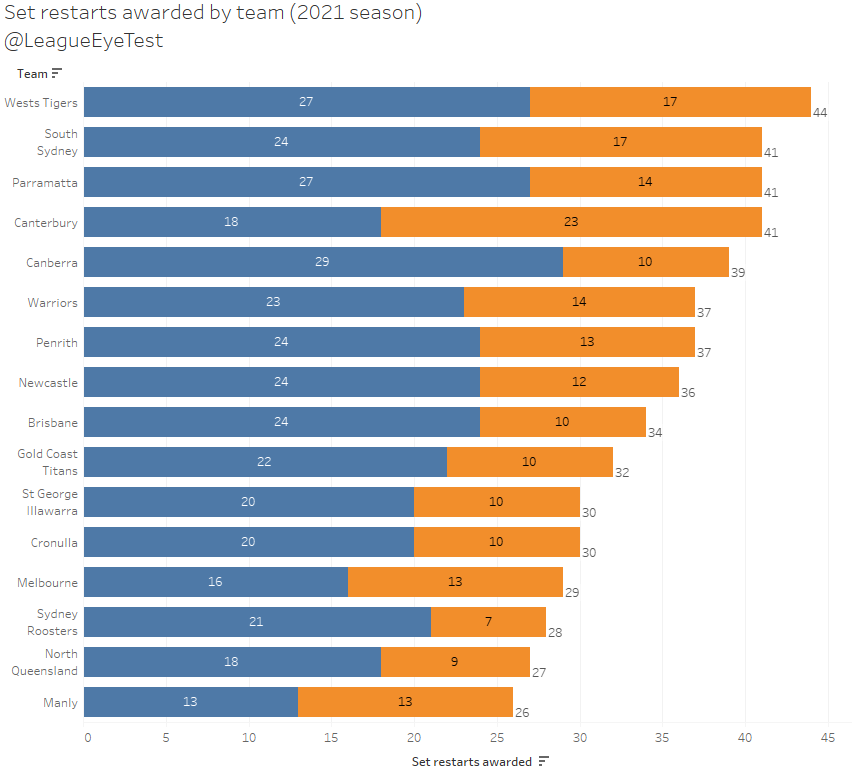
The Wests Tigers have had the most set restarts go their way this season, with 44 in their nine games this season, just ahead of a trio on 41 (South Sydney, Parramatta, and Canterbury). Across the league there’s a pretty constant trend of teams receiving more set restarts in the first half than second half, with the notable exception being the Bulldogs who are the only club to receive more than 20 restarts in the second half this season.
Flipping things around, who are the worst teams at conceding set restarts?
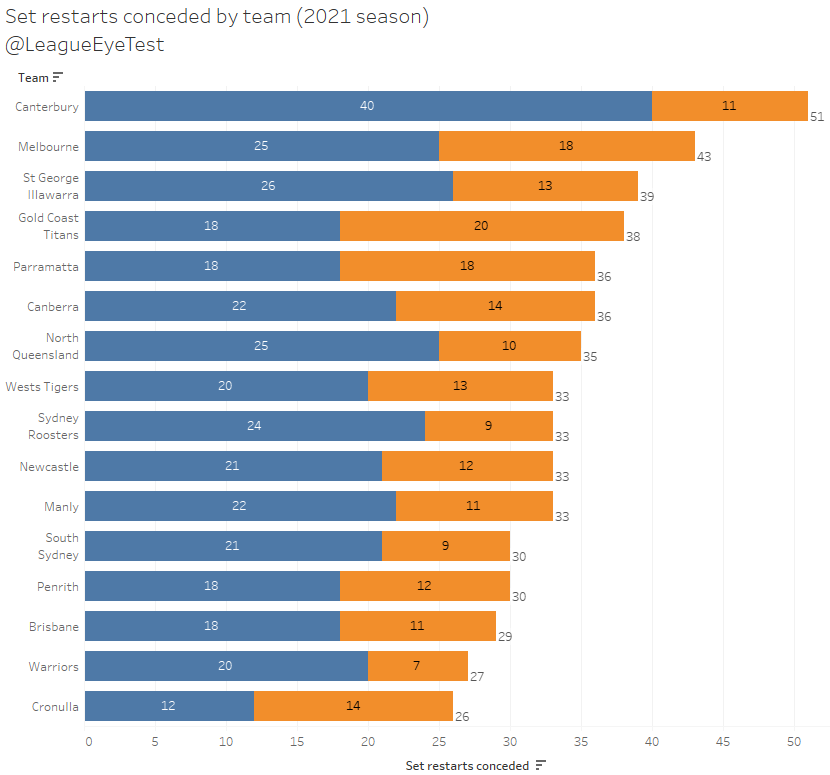
It’s a landslide here with the hapless Bulldogs conceding 51 set restarts this season, eight ahead of second placed Melbourne with 43. In fact, the Dogs have conceded more first half set restarts (40) than the total restarts conceded of all but one other NRL club.
Let’s move on to the same charts for penalties awarded and conceded.
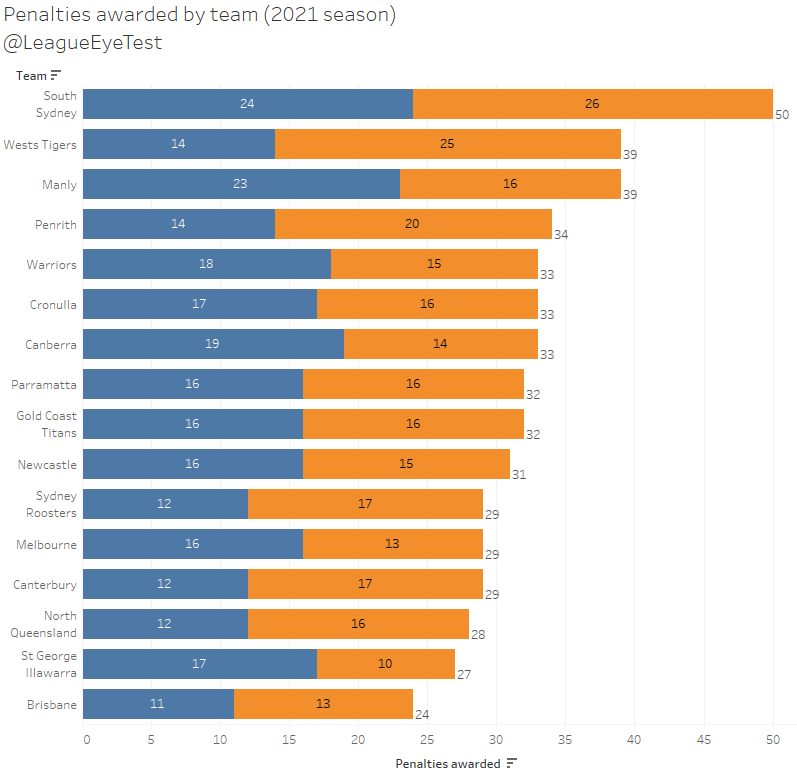
South Sydney have been by far the biggest beneficiary of penalties this season, with 50 in their nine games, 11 more than the next closest teams (Manly and Wests Tigers). Souths have had more second half penalties awarded (26) than Brisbane have had all season (24), which a considerable amount of extra possession for the Bunnies.
Now on to penalties conceded by team this season.
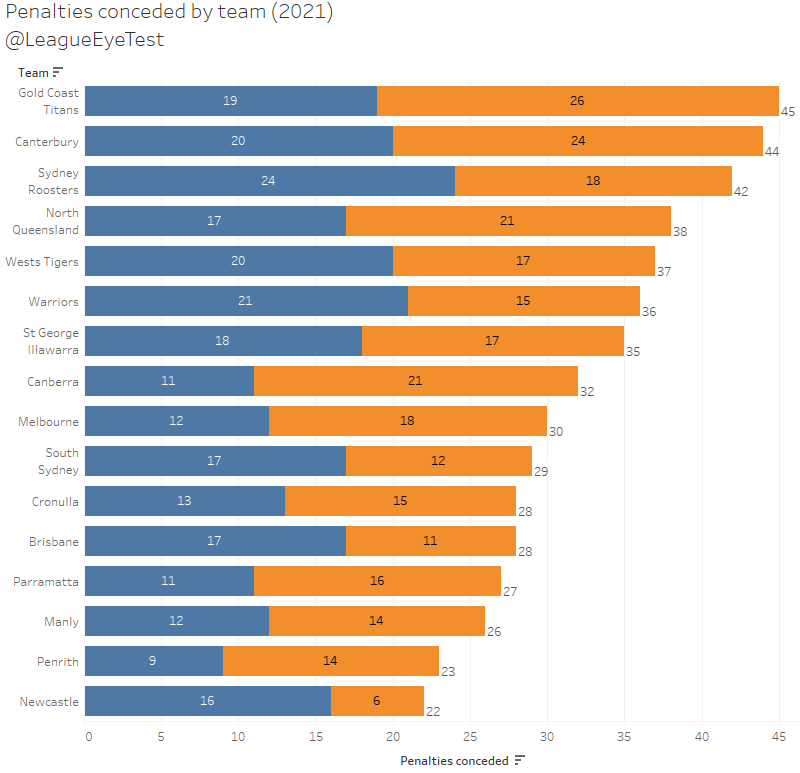
The Titans, Bulldogs and Roosters leading the way, all with more than 40 penalties conceded this season. Newcastle is by far the most disciplined team in this regard, giving up only 22 total penalties and just six in the second half, fewer than one per game. No other team has a half in single figures.
Now we’ve established who is benefiting and suffering from these infringements, let’s look and see how it relates to winning, which is why the games are played. Before we look at 2021, it is worth checking where things were last season. Below is a chart of net set restarts (awarded minus conceded) plotted against net margin for Rounds 3-9 2020.
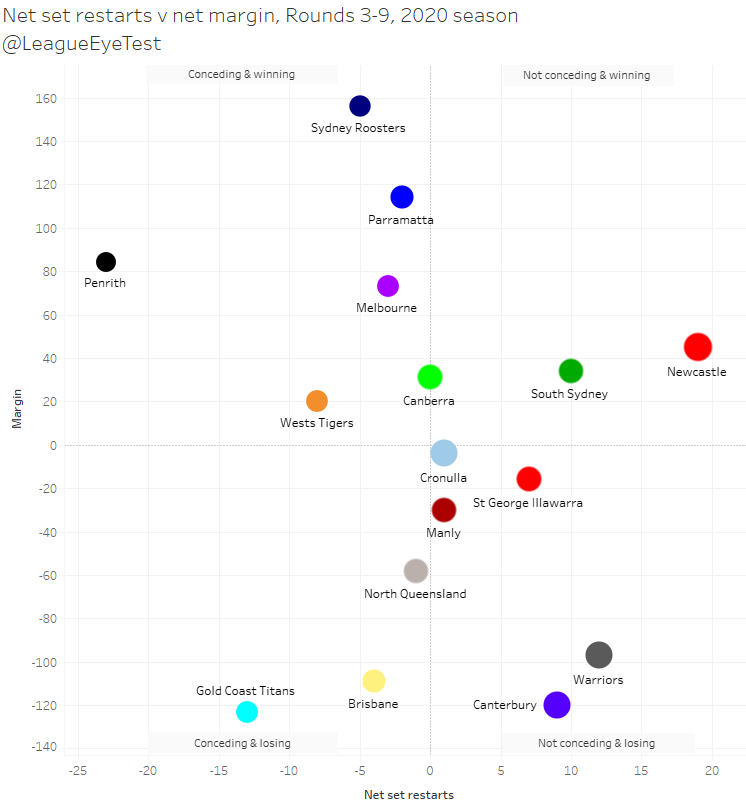
Last season at this time, Penrith had conceded 23 more set restarts than they were awarded, which obviously worked for them. And it’s a great reminder for those who believe that this gaming of set restarts might be a new thing in 2021, it isn’t’. After just seven rounds of set restarts purely for ruck infringements in 2020, it was pretty clear that the top four sides at the time (Penrith, Sydney, Melbourne, and Parramatta) had worked out how to game them.
If we look at things for the 2021 season, with more infringements able to be called for a set restart, things are quite different. Here’s the same chart as above for 2021.
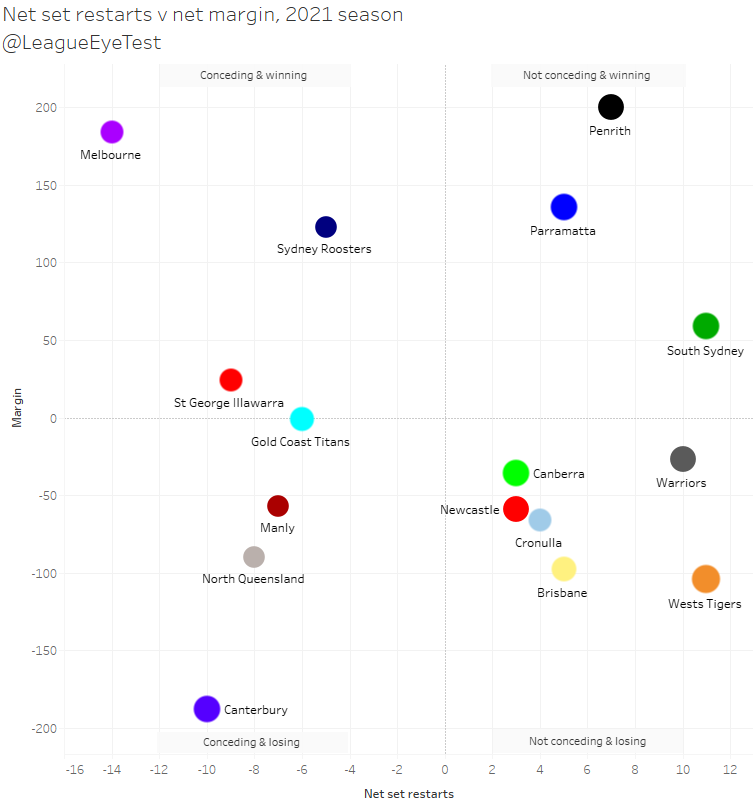
Melbourne are the Panthers of season 2021, conceding 14 more restarts than they’ve been awarded. The Roosters are the only other team in that “conceding and winning” quadrant. They’re both still using set restarts as a way to manage field position, confident in their defense to hold opponents out.
The other significant change is that the remaining major contenders for this season aren’t conceding more set restarts than they’re awarded, with Parramatta +5, Penrith +7, and Souths +11. These teams are looking more at maintaining position and pushing the ball through the middle and not letting opponents get settled defensively.
The rest of the competition can be grouped mostly into the other two quadrants, “conceding and losing”, containing the Bulldogs and slow starters like the Cowboys and Sea Eagles, and the “not conceding and losing” quadrant, which has most of the mid ladder teams who’ve given up a big score to one or more of the top five sides.
The last thing I wanted to look at was if there was any relationship between net set restarts and net penalties. Do teams only concede set restarts? As you might expect, there is some relationship.
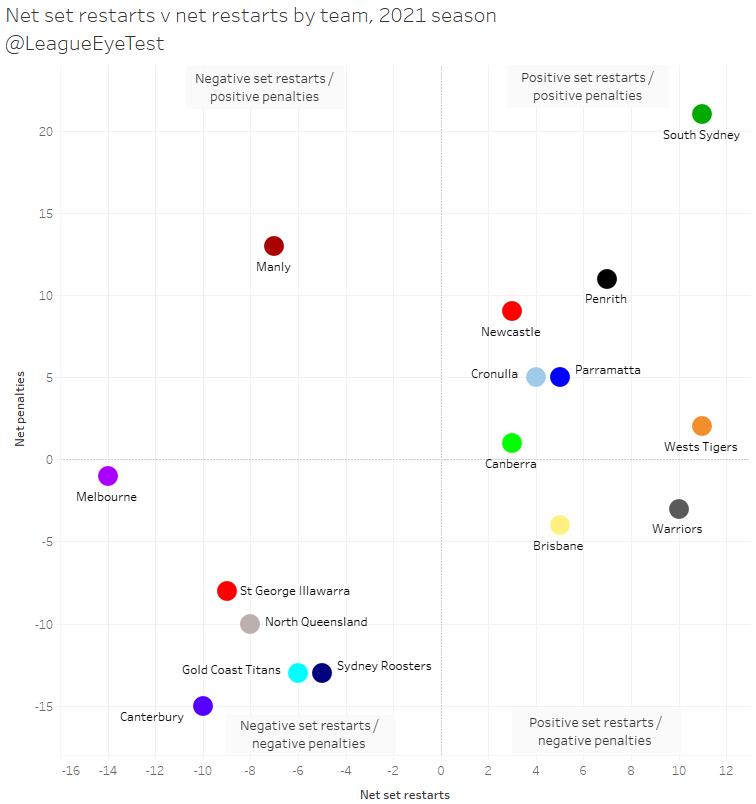
Teams that generally concede more set restarts than they’re awarded also concede more penalties. The Roosters are -5 on set restarts and -13 on penalties, whilst Melbourne are -14 on set restarts and -1 on penalties. As we saw before, Souths are +11 on set restarts, but they’re also a whopping +20 on penalties. Manly is the only real outlier in this view, sitting at -7 on set restarts and +13 on penalties.
It’s not as clear cut this season that managing your restart counts is helping contending teams, but it’s still a case that possession and field position are as important as ever.
Matt Dufty tightening up his defense
The Dragons are currently sitting in sixth place on the ladder, and Matt Dufty has been one their keys as you would expect. He’s been as elusive as always with the ball, but it’s the other side of the game that has impressed me this season.
In 2020 Dufty gave up 21 try causes in 18 games, around 1.2 per game. Thus far he has just six in 9 games, around 0.7 per game. When you combine try causes with line break causes, in 2020 he was in the 54th percentile of all outside backs, meaning that 46% of all outside backs gave up fewer line breaks and tries than Dufty. Not exactly the sort of defensive effort you’d expect from a starting fullback on a team with top eight aspirations.
In 2021 that percentile rank has crept up to the 73rd percentile, which still isn’t in the elite tier but still an impressive improvement to go from sitting in the middle of the NRL to almost top quarter. Dufty’s percentile ranks this season compare favorably with James Tedesco, who may not be having his best season behind a crippled Roosters pack, but he’s still one of the biggest gamebreakers in the competition.
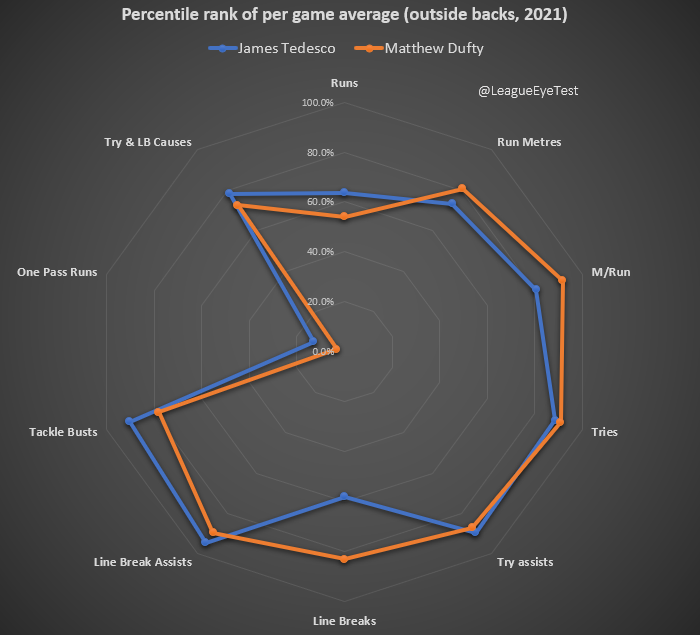
Dufty has always been one of the better attacking fullbacks but his defensive lapses were always a talking point. If this improvement continues, he could be on the heels of the big four NSW fullbacks.
If you enjoyed this post please consider supporting The Rugby League Eye Test through one of the links below.
[crypto-donation-box type="tabular"]


The stats don’t lie, a really fascinating read.. great work💪🏾
I’m as cynical as the next guy these days & noticed that my team, the Warriors nowadays rarely contest offensive bombs, well until the oppo player has landed. Also they don’t hold down in tackle per some yet don’t get the rub of the green in crucial game moments.
Reason being imo is the threat of momentum losing punishment yet if you can’t confidently contest these areas it’s bloody hard to gain ascendency.
Incredible stat for me is re injuries, in Penrith’s case lack off, 2nd yr running. They’re obviously doing something very differently pre season, pre & post game.. or they’re extremely fortuitous.
Thank you for the great info & work in the game. Wish the fox network were as unbiased, thoughtful & conscientious as you🙏🏾