After spending the last few weeks looking at the timing, margins and tackles where set restarts occur, this week the Eye Test is continuing to break down those numbers on a team-by-team basis to look at where these infractions are occurring on the field and which tackle teams are conceding them.
Before we get into the team breakdowns, I want to revisit the analysis from the last post on the site concerning which tackle restarts were conceded on. In noting that the average restart awarded 2.3 more tackles because so many of them occurred on tackle one, r/NRL Reddit user Abbabaloney raised a great point about first tackle restarts. Their point was that there should be more first tackle set restarts because there are more first tackles. This makes sense and they’re right, there are more first tackles. They suggested the best way to look at them is the rate of restarts per tackle.
Are there more restarts on tackle zero or one because they occur more often? Zero or first tackles account for just under a quarter of all play the balls so far in 2021. Second tackles are almost equal at 23.5%, dropping to 21% for third tackles and then another 30% for tackles four and five combined. Holding possession through to the sixth tackle happens about 1% of the time.
What is the rate of restarts per tackle then? For first tackles, they occur about 3.4% of the time. That drops to 3.1% on second tackles and 2.6% on third tackles. If you’re paying attention, there’s less than 2% drop in instances of first and second tackles occurring, but set restarts transpire 8% more frequently on first tackles than they do on second tackles.
This continues as you move through the tackle count. There’s nearly 12% fewer third tackles than there are second tackles, but they’re happening nearly 20% less regularly on those tackles. Again we’ve proven that set restarts are predominately occurring on first and second tackles, not just by volume but also by rate.
We’ve firmly established the occurrences of set restarts early in the tackle count, let’s move on to when and where each team are conceding them. First up, on which tackle are teams giving up a restart? The percentage of each tackle when a restart is called by team for 2021 are below, ranked by the percentage occurring on first tackles. There’s also a league wide average column on the right.
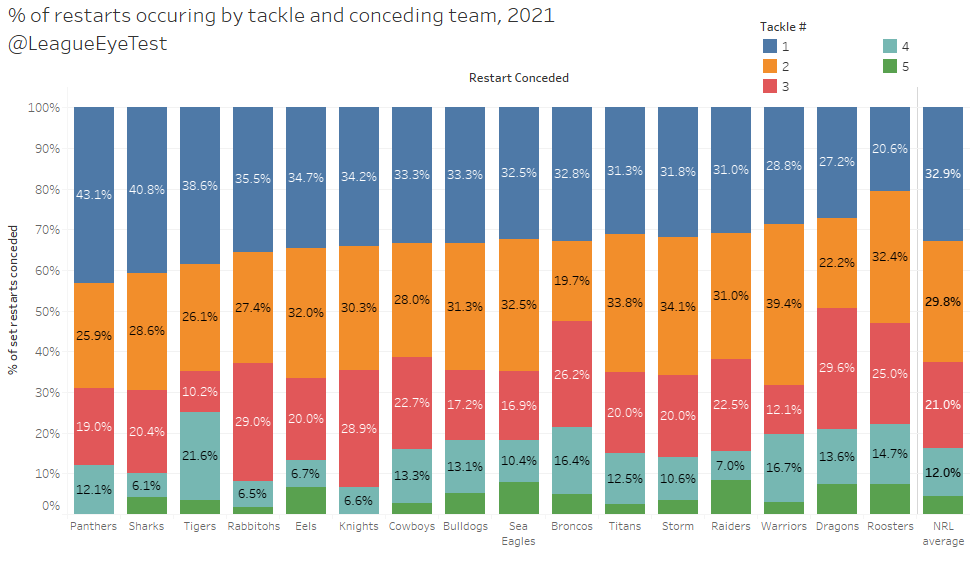
It should hardly be surprising to see the Panthers leading the way, with over 43% of their set restarts occurring on the first tackle. Another 26% of their restarts occur on the second tackle, meaning nearly 70% of their six agains conceded are on the first or second tackle. The reason it isn’t surprising is that we showed last week that the Panthers were only giving up 2 extra tackles per game on average. When you see the visualisation of their restarts conceded later, it will be come clear just how much they’re gaming this system.
You’d probably expect to see the Storm not for behind, but shockingly their first tackle % is fifth lowest in the NRL. Where they make up for it is on second tackles, where they concede 34% of them, second in the competition behind the Warriors (40%!). When you combine those numbers, it makes 66%, only slightly behind the Panthers at 69%. More proof of the use of set restarts as a way of controller field position early in sets, which you’ll see in the Storm’s visualisation later in the post.
The Roosters have been doing their own thing this season, only giving up 20% of their six agains at the start of a set. You’ll see later that they appear to be using them primarily as a way of holding defenses at their line, rather than limiting their early metre gains.
The worst late tackle offenders are the Tigers, who give up 21% of their restarts on fourth tackles (ouch). No other team is above 20% for fourth tackles, with the next highest being the Warriors at 16.7%.
What about location of restarts by team? The eye test (not this one, that one) would indicate that a lot of them are happening inside teams’ own halves as they return the ball after a kick, allowing the defending team to control their momentum and prevent high metre gains.
Here’s how each team splits their restarts conceded in their own and opponents halves, sorted by percentage in opposition half.
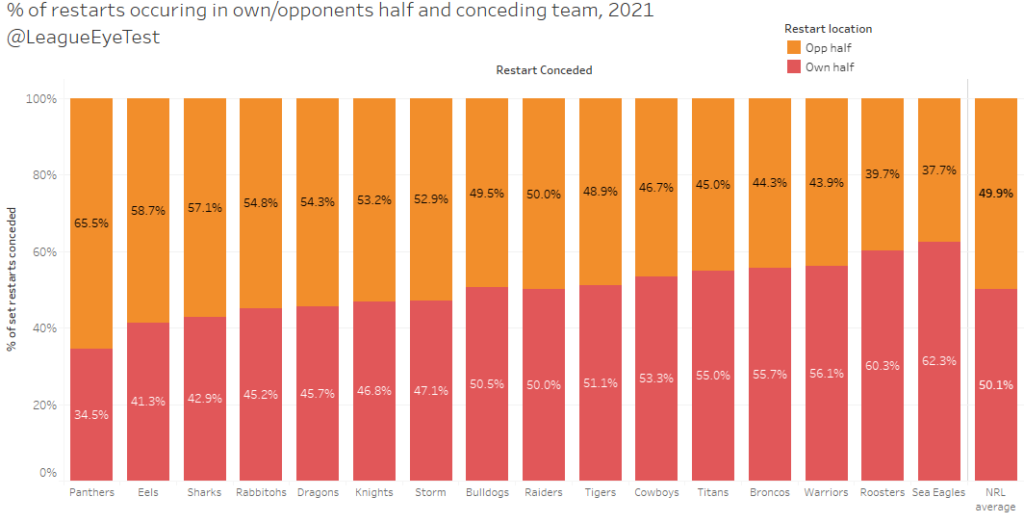
Penrith are top spot, with nearly two thirds of their restarts called in an opponent’s halves. Not only are they using them early in tackle sets, but they’re also using them more in opponent’s halves. Other top four teams are using them more in their opponents’ halves as well, with Parramatta, Souths and Melbourne all over 50%.
The Roosters buck the trend as well, giving up just 40% of their restarts in opponents halves, only bested by Manly who give up just 38% inside their rivals 50. When we get to visiualising these numbers later, these two teams really stand out.
Interestingly, there’s a 50/50 split in both halves for set restarts. This means even with the suggested rule change to penalties in your own half and set restarts in the attacking half, you’d only be eliminating half of these restarts. On the positive side, it would be eliminating the most cynical ones, but for most it probably wouldn’t be going far enough. But I digress.
Getting back on track, if you break that field position down even further, are teams using restarts as a method of control more inside the 20 metre area of an opponent’s half, or midfield? Here’s the same chart again with each half broken out to 0-20m and 20-50m zones, sorted the same as the previous chart.

Yet another example of Penrith leading the way, with 50% – yes HALF – of their set restarts conceded coming between their opponents 20-50m zone.
The Sharks raise an interesting profile as well. They concede nearly 60% of their restarts in an opponent’s half, third in the NRL, but are the worst at giving them up inside their midfield (20-50m) area, at 33%. That number is even worse than notorious six again offenders Canterbury at 29.6%. This would indicate that the Sharks game plan is to try to use set restarts to contain teams in their own area, and if that fails to try to keep them from reaching their own red zone.
We’ve established which tackle and the rough location of where each team is conceding their restarts, it’s time to look at exactly where on the field each of these restarts are occurring.
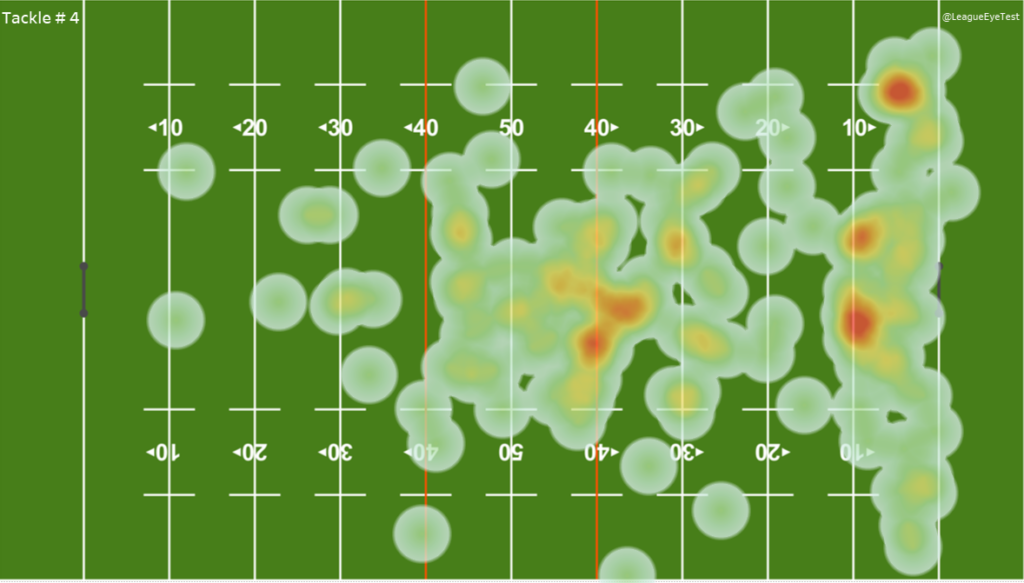
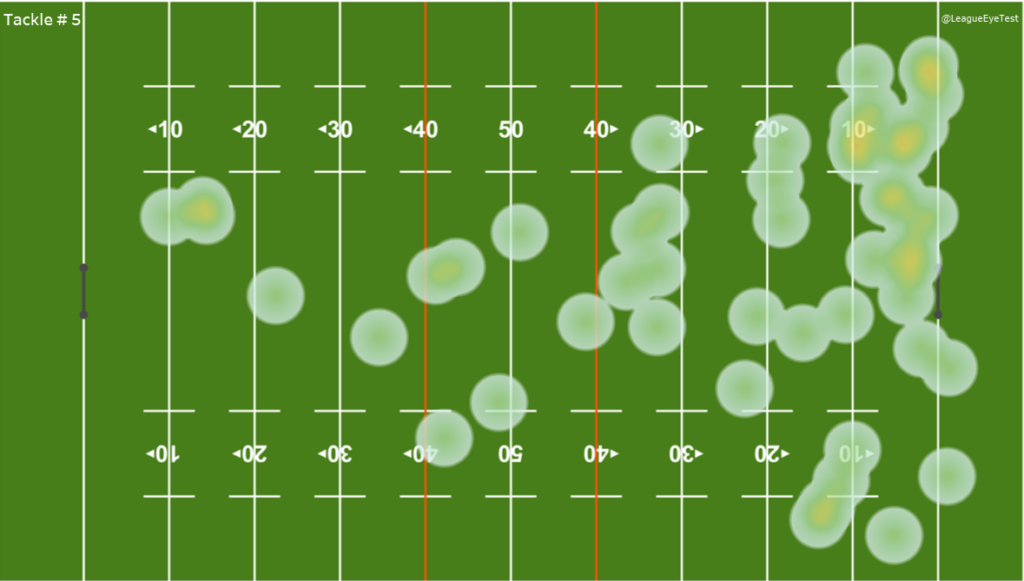
Last week I posted an animated gif of the location of every set restart by tackle, but felt it didn’t show the intensity of restarts inside a team’s own half. To get around this I’ve changed to heat maps which show more clearly. Below is a gallery of the heat maps of the location of every restart by tackle up to Round 21.
As talked about in the previous post there’s some obvious tendencies here and I’ll recap again for those who missed it. First tackle restarts are yielded well within an opponent’s half, mostly inside the 10-40 metre zone, and somewhat by teams defending their own line in the middle of the field. Second tackle restarts are primarily between the 20-50 metre area, again with some from teams defending their own line. Tackle three restarts are mostly midfield, whilst tackle four restarts are rarer and more likely to be about 10 metres out from the line. Fifth tackle restarts rarely occur but if they do its usually inside the last 10m near the try line on the left side of the field.
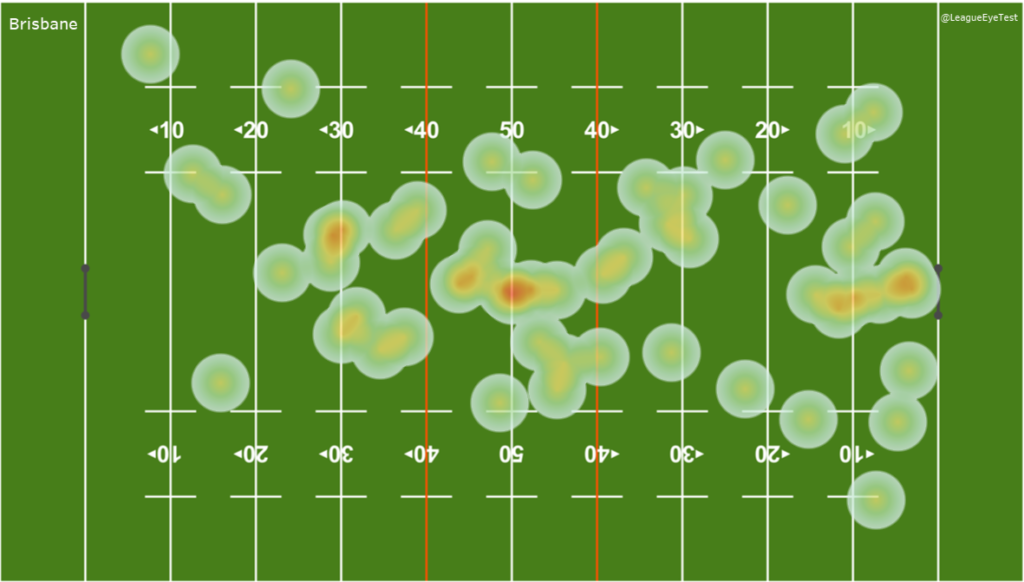
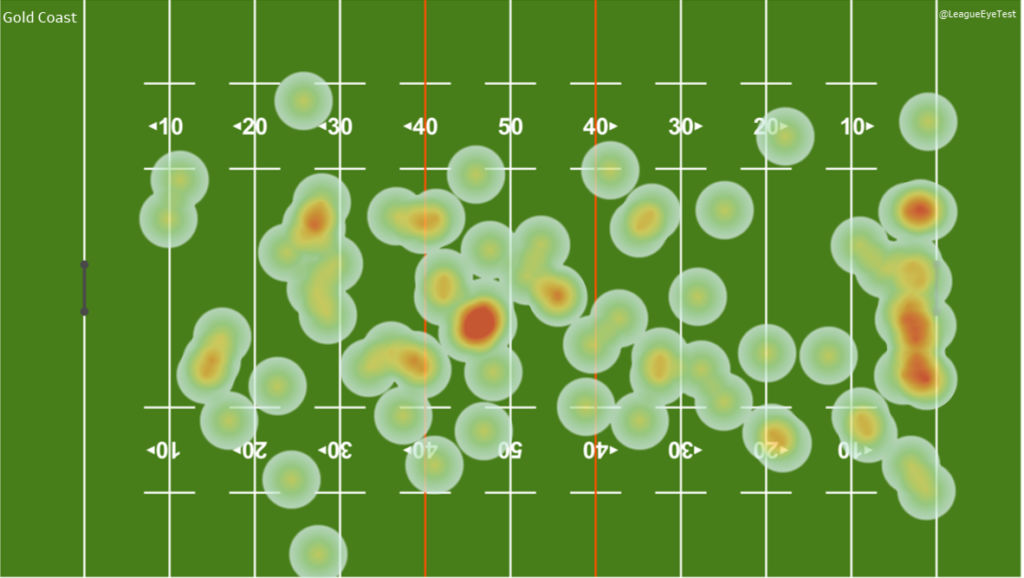
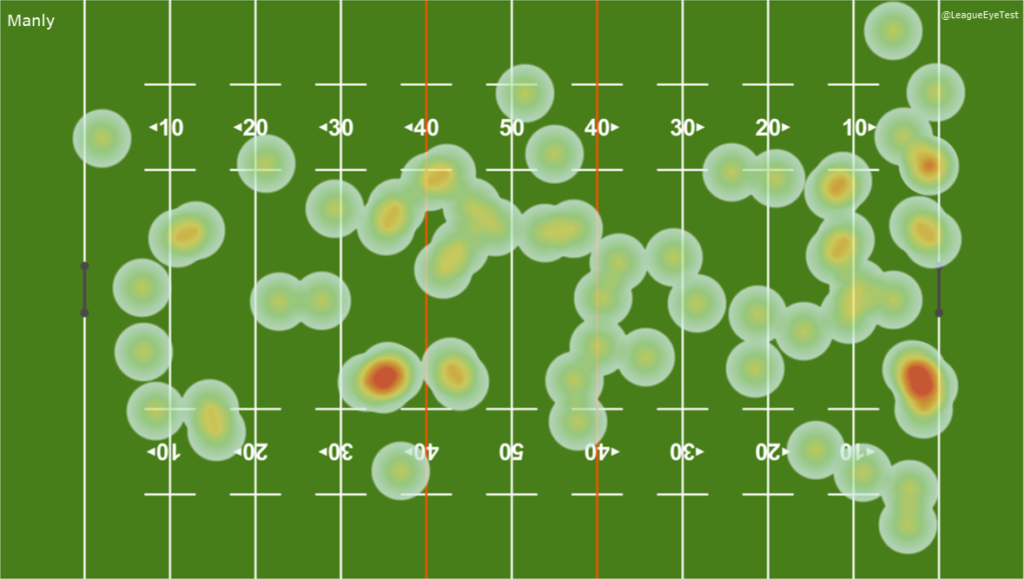
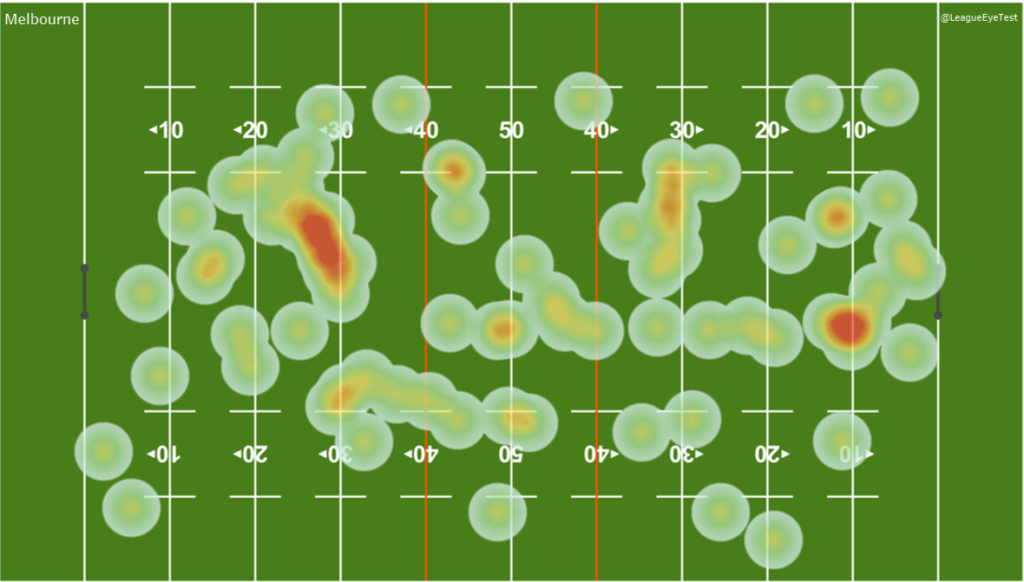
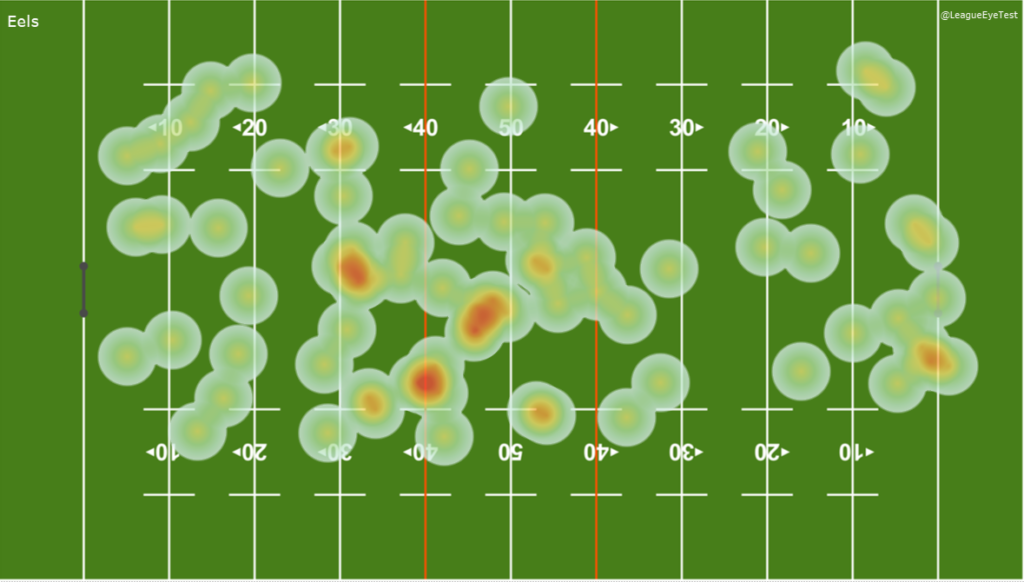
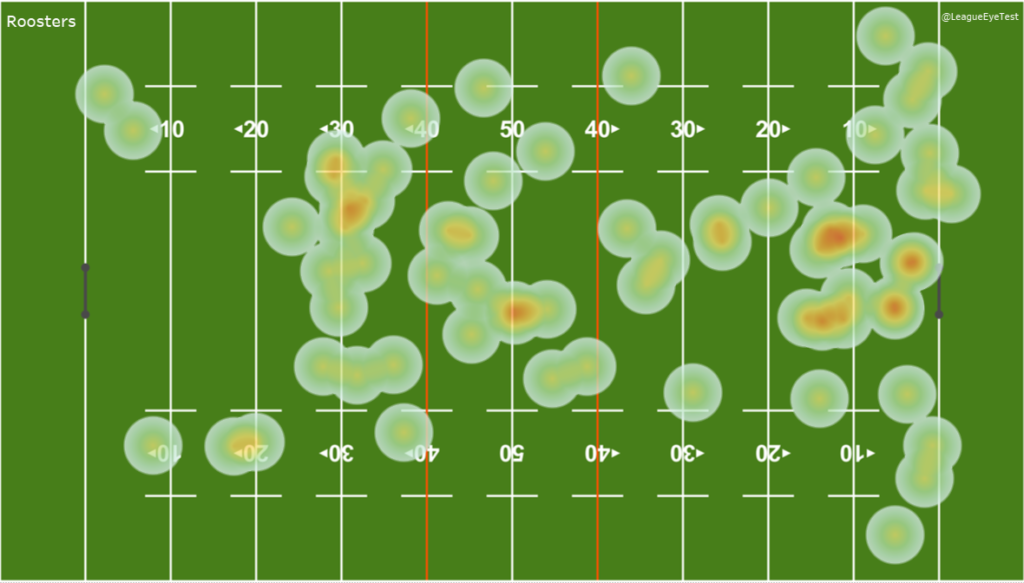
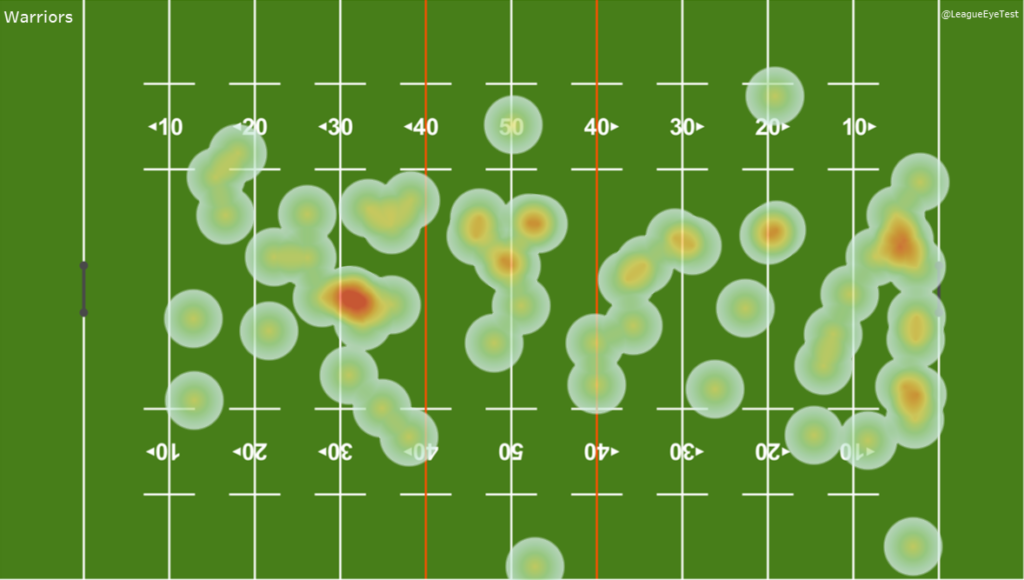
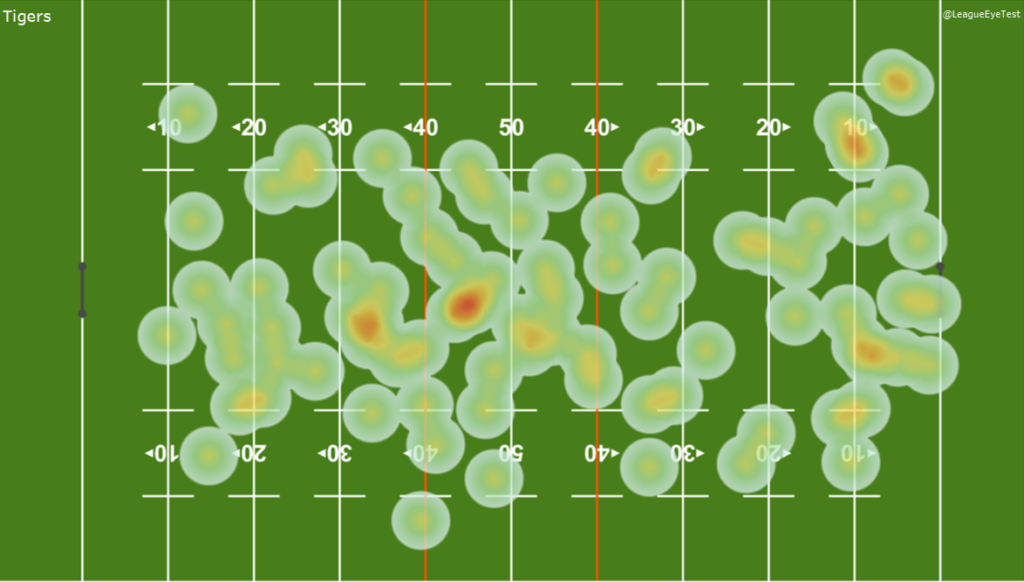
Now that we’ve seen the overall trends by tackle, below is a gallery of a heat map of every team’s set restarts conceded this season. The top left-hand corner shows the which team is displayed as well as below in the gallery.
There’s definitely some interesting trends here with the intensity of the heat maps and you can see the tendencies I pointed out earlier in the post. It’s very clear to see that Melbourne and Penrith are conceding them strategically in their opponents’ halves, especially in the 20-50 metre zones.
Penrith in particular have a huge gap in the attacking midfield (50m-20m) where they aren’t giving away set restarts, something no other club in the competition is doing. Other clubs may have less occurances of them in parts of the field, but still concede them. Only one club has a blank part of the field and that’s Penrith.
The Roosters and Manly are eschewing the trend of giving away a high number of six agains in an opponent’s half, with both sides tending to concede them more on their own line as way of stifling attack.
Gold Coast tend to concede a large number of them in the middle of their field defending their own line, as do Newcastle but closer to 5m out than on the line itself.
Teams who have been performing poorly this season don’t share a specific profile for restart locations. Brisbane, Wests and North Queensland tend to give them up all over the field, although there is still likely to be more of them inside an opponents’ half. The Bulldogs in particular give away a ridiculous amount around the halfway mark, while the Dragons prefer to use theirs in midfield or on their own line.


