The advanced statistics for the NRL and rugby league in general that Eye Test introduced – Tackle %, Run % and Involvement Rate – have been around for a few seasons now, and I’ve been reasonably happy with the results. They’re not perfect (I don’t and never will claim them to be) and no one single statistic will ever solve any sport, let alone one with as many simultaneous moving parts as rugby league. But as metrics for tracking player workload I feel they offer an accurate representation of what is happening on field.
Yet there’s always been something about Run % that I’ve not been comfortable with. The current way Run % is calculated tends to favour low minute, high impact forwards off the bench who come on for 15-25 minutes a game and run the ball half a dozen times before coming off. That isn’t necessarily a drawback – one of the reasons I created it was to quantify the work those types of players put in, which isn’t usually recognised. But it’s not as complete a picture of effort with the ball as I’d like it to be.
With this in mind, I’ve added another advanced statistic to the slate here at the Eye Test this season which hopefully neutralises some of the benefits interchange forwards receive from Run %.
Total Run % is new for 2022 and is a relatively simple adjustment. First we take the current Run % calculation (Player Runs * Minutes played)/(Team plays * total game minutes), which to summarise is possession adjusted runs per minute – you can read more about it here. Then we simply add in decoy and support runs to create a “total runs” statistic for the numerator and use the same denominator to adjust for possession and time.
Thus the new equation is ((Player Runs + Supports + Decoys)* minutes played) / (Team Plays * total game minutes). It increases most players Run % by around 4-6%, some even more than that, and gives a better perspective as to how often a player gets involved whilst his team has the ball.
Total Run % is more favourable to higher minute middle forwards, who are often the ones running decoy for their fresher teammates and tend to have a lower Run % than their interchange compatriots. That’s not to say it’s only those players who benefit from this change – last years Run % king Spencer Leinu still comes in third this year – it just levels the playing field somewhat.
For reference, here’s the chart for Run % leaders in 2021.
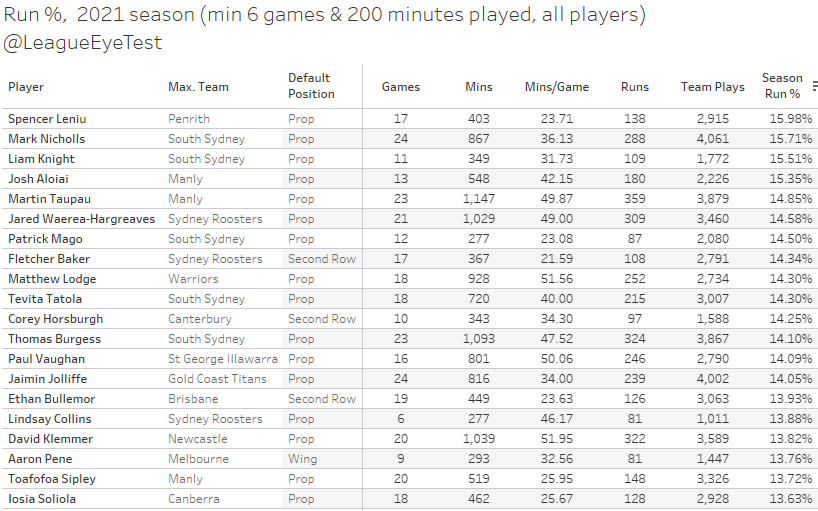
Now lets look at Total Run % alongside Run % to see where the differences lie.
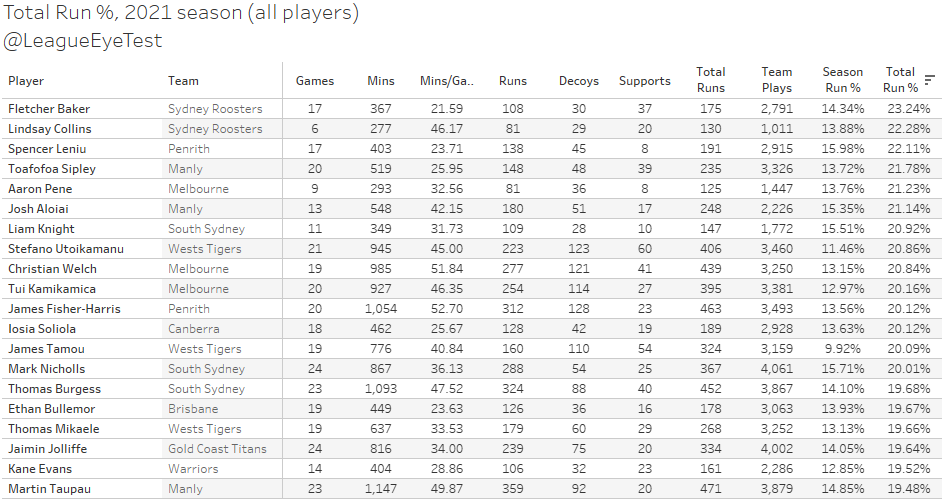
Straight away you can see a difference. Roosters pair Lindsay Collins and Fletcher Baker take the top two spots along with last years Run % king Leinu. It further highlights just how important Collins is for Trent Robinson and how much he will relish his return this season. Tui Kamikamica, Stefano Utiokamanu and James Tamou were rarely seen leading Run % numbers but sit inside the top 15 for Total Run %.
Utoikamanu specifically was a workhorse when his teammates were carrying the ball, ranking fourth in total decoy runs and fifth in total support runs despite playing just 45 minutes a game. Most players around him in those metrics were playing upwards of 50 minutes a game. Tamou’s output practically doubles, from a run rate of 9.92% to 20.09% for Total Run %. Only Rudolf and the Dragons’ Poasa Faamausilli saw increases in that range.
The easiest example of how Total Run % better quantifies running effort isn’t even seen on this chart. Cronulla’s Toby Rudolf who had one of the lowest Run % of a middle forward for the 2021 season at just 9.94%. For context, backs like Ken Maumalo and Dallin Watene-Zelezniak both had higher run rates in the low 10% range. No one would suggest that they were working harder with the ball throughout the game than Rudolf, even if they are hard workers for their position.
The big difference in their involvement overall is in decoy and support runs. The below chart shows average decoy runs plotted against average support runs per game, which highlights the amount of off ball work Rudolf is doing.
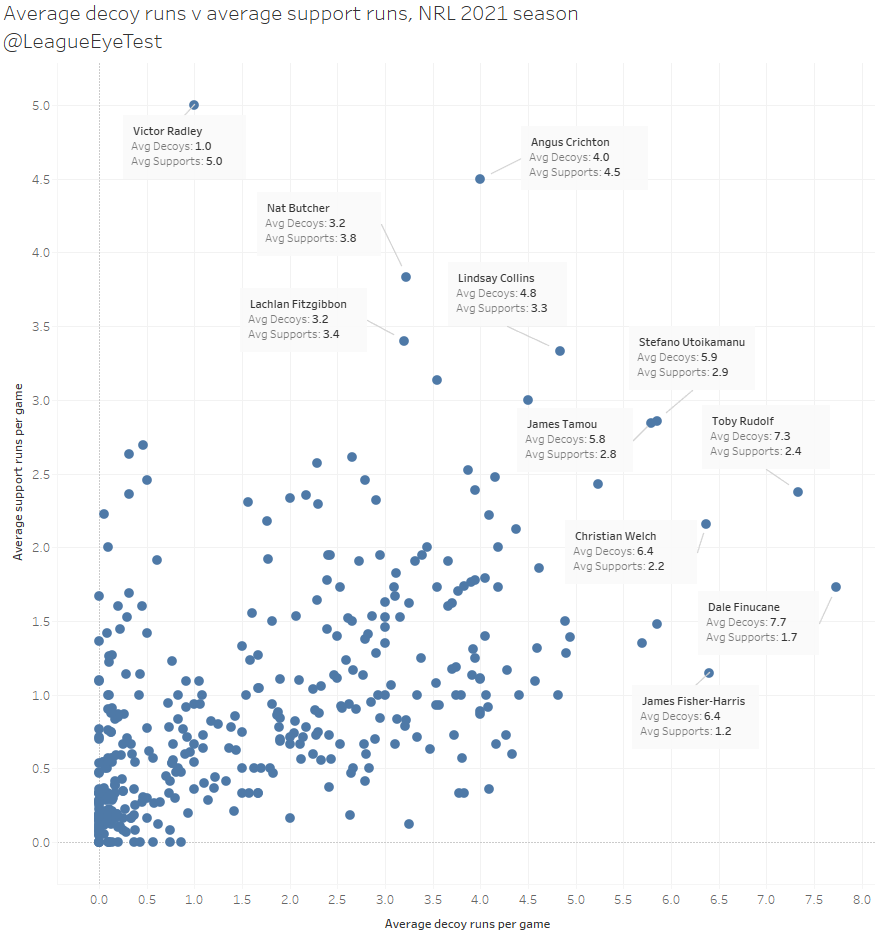
Maumalo and Watene-Zelezniak had a combined four decoy runs last season and 21 support runs. Rudolf had 176 decoy runs alone, the most in the NRL last season and nearly 50 higher than second place, Penrith’s James Fisher-Harris with 128. Add in another 57 support runs and Rudolf’s moves from a 9.94% run rate to 18.10% total run rate, which moves him from 96th overall to 33rd, a far better representation of his value to Cronulla. There’s few players who put in the same volume of both decoy and support runs. Dale Finucane matches him for decoys, but doesn’t have the same level of support runs.
It’s worth noting here that the difference between a decoy and a support run could be extremely subjective depending on who is recording it. It could be the timing of a run, or the direction of a pass that could cause a decoy run to be tagged as a support run or vice versa. The Fox Sports decoy run numbers (which I’m using for this metric) can be quite different from the official NRL stats as well, but if you add in support runs they’re not too far apart. Which is why I’ve used both statistics for Total Run % rather than just supports or just decoys.
Run % will continue to exist as a metric for evaluating players completing runs during their time on field, and Total Run % will coexist alongside it as a more complete version. Given this change to Run % to make Total Run %, I’ll also be adjusting Involvement Rate for 2022 to include decoy and support runs which I feel makes Involvement Rate a better representation of overall workload.
If you enjoyed this post please consider supporting The Rugby League Eye Test through one of the links below.
[crypto-donation-box type="tabular"]

