Before the start of the 2023 NRL season I tried a thought experiment where I used this site’s player attribution metric (ETPCR) and tried to project player salaries for the upcoming season. I wanted to see if I could use this metric to predict performance for players this season and judge how well it worked.
You can go back and read the post now, but the methodology hasn’t changed. Here’s the quick version as a refresher but I’d highly recommend reading the original for my thoughts on the process before moving on.
Using the data I have going back to 2014, I set a replacement player level ETPCR value for each position. Then we calculated how many minutes were played by players at or above a “replacement level” which gave me a rough dollar per minute value.
After all there’s only so many minutes to be played and there’s (theoretically) a finite amount of dollars each team can spend for players to play those minutes, and anyone not playing valuable minutes could (and probably should) be paid minimum salary. Underachieving clubs paying overs for marginal talent, or overvaluing your own current list is how you end up like the Wests Tigers.
Moving on, I then predicted each players “salary” based on minutes played, weighted by their value over that replacement level. This was based on the current salary cap and what was assumed to be the new cap once the new collective bargaining agreement was agreed on, which at the time was very much a fluid situation.
Please note that these projections are based on minutes per game and make an assumption that every player will play approximately 20-24 games per season. Which is probably too kind for injury prone players but I wanted to get an idea of what every player would be worth with comparable games played. Obviously in reality there’s a massive decision to be made on how much a player is worth if they’re sidelined for half a season.
As noted before the season, it’s not mathematically perfect but looked like a good starting point, and the salary is a good proxy for player performance. To me this isn’t necessarily about the final dollar figure for each player, but where they rank and whether or not you could find a similar level of performance from another player at a cheaper price.
And since I don’t have actual NRL salaries for comparisons sake, I can only create projections to compare with on field performances. The real value would be comparing this value to actual dollars spent on players, but that’s not likely to happen anytime soon.
So how did I go?
The results were mixed. For some positions and players, it worked quite well. But for others very poorly and looking back at it some of the reasons should have been obviously clear. Overall as a thought experiment I think it worked even if the results weren’t overwhelmingly positive. Let’s dive into what worked and what didn’t.
As a starting point here’s a plot of my projected salaries with what their end of season value would be worth in dollars based on predicted performance (vertical axis) versus actual performance (horizontal axis). The further to the right the better the actual performance was. I’ve also limited it to players with at least three games played to filter out any small sample size noise.

Overall, the r squared (how well it fits) of this plot is 0.35, which on a range of 0 to 1 isn’t great but it’s also not terrible, and I’ve some ideas below on how to improve it next year. Some positions had a better correlation (locks, wingers) whilst some positions fared worse (centres specifically for some reason).
I’ve put call outs on most of the big players to identify who the projected top earners were and how they fared, as well as some of the players who weren’t predicted to do well but did so. There’s no one on this list who has a high projected or actual predicted salary who shouldn’t be there. Tom Trbojevic is the most contentious one, but that’s due to his salary being assumed to be for a player who plays 20+ games a season, not 10-12.
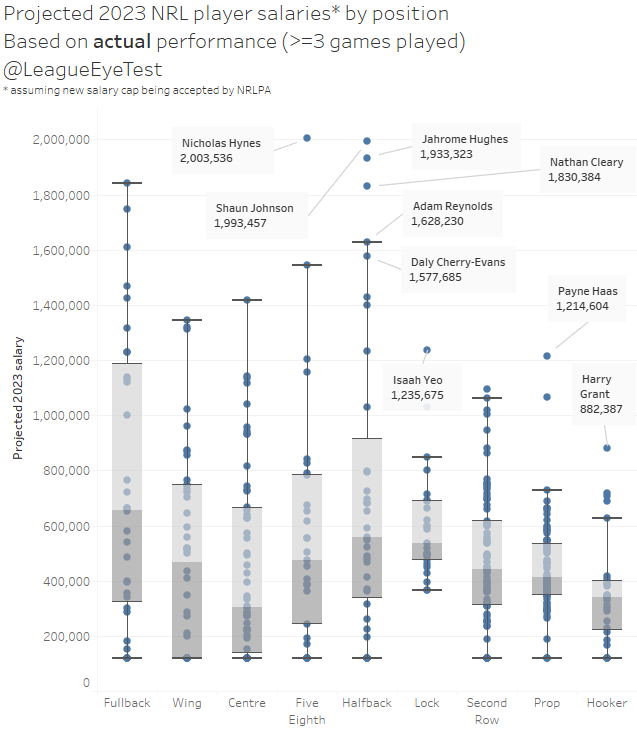
Next here’s an update to the box and whiskers chart I used in the initial post, showing the outliers by position and which quartile players are sitting in.
If we now look at the variances for specific players, first I’ll check the players I got right. Here are the players with the smallest difference in projected salaries (predicted vs actual).
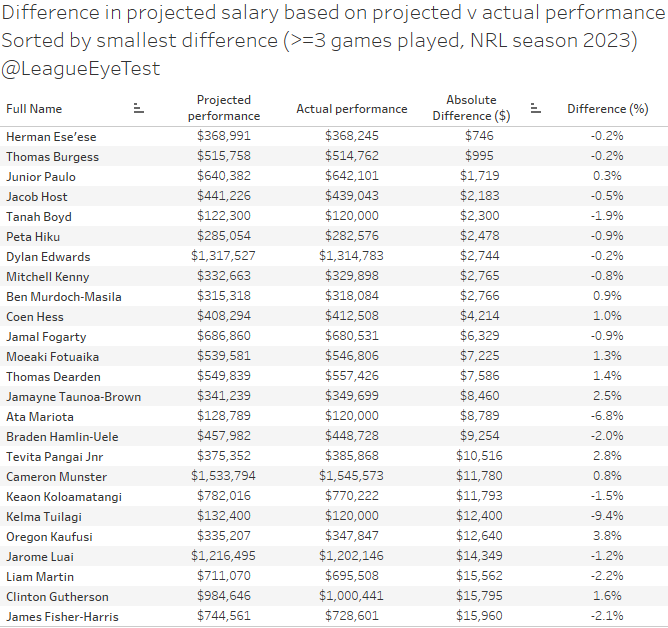
This list shows that this system does work well for a wide range of positions and from good and bad teams. There’s even a hooker in this list which I’ve noted before is the hardest position to quantify performance by stats alone, especially when you take out something like tackles made which don’t correlate with winning games.
It also covers the top and bottom range of pay scales and player performances. Only being 0.2% off on a player like Dylan Edwards or 0.8% off on Cameron Munster is a great marker of success, as is only missing Junior Paulo’s worth by less than $2,000. Getting players like Ata Mariota, Peta Hiku or Ben Murdoch-Masila right also means that a player’s role isn’t necessarily going to cause problems predicting player worth.
And that’s not even counting the list of players who I had predicted as minimum salary players at the start of the season and that’s how they played, which included Jayden Okunbur, Asu Keapoa, Jayden Sullivan, Tommy Talau and Christian Tuipulotu.
Now we’ll look at the misses, and there’s some big ones but some of these would be expected.
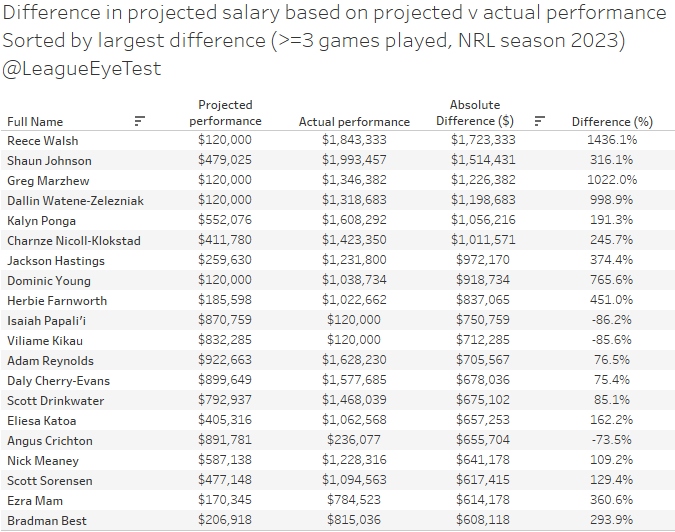
Obviously, Reece Walsh is a huge outlier, and it’s something I noted at the start of the season. By projecting based on his prior three seasons, with significantly more weighting for the most recent season, his salary ended up projecting as a minimum level player.
Which is ridiculous even if you assumed he would just bring his Warriors level play to Brisbane, let alone emerging as one of the best fullbacks in the competition. And if I don’t mention the impact Lee Briers had for Brisbane here, friend of the site Mike Meehall Wood will be sending me more angry DMs than usual. Having more try assists in 2023 than his prior two seasons combined is part of it too, and he was doing them in approximately the same number of touches per game, as noted by another friend of the site Jason Oliver.
If we’d just used his 2021 numbers, he would have projected out at around $450,000. But as I noted before the season, it’s the extra weighting of his 2022 season that dragged him down to a minimum level player. Still a far cry from the near $2million he ended up at, but much closer to what would have been expected of him based on last season’s numbers. There may also an issue with age projection which I’ll touch on later.
It’s nearly impossible project for someone like Shaun Johnson having the season he did at 32 after multiple serious lower leg injuries. Johnson was another outlier, but I don’t think even the biggest ShaunHub fans would have expected a career renaissance at this age after multiple serious leg injuries. These sorts of anomalies shouldn’t be easy to predict.
The other players on this list are from clubs that had a huge turn around in fortunes (Newcastle), moved teams (Walsh, Isaiah Papali’i, Viliame Kikau) or reverted to the mean after a strong 2022 season (Scott Drinkwater).
It does show that most of the missing is being done by under projecting players, who make up all but three players on this list. For someone like Dom Young going from 14 to 25 tries helps, but also playing on a Knights team that was one of the best defensive sides in the competition for the second half of the season made a huge impact. That impact can also be seen for Ponga, Jackson Hastings, Greg Marzhew and Bradman Best as well.
What these results have led me to realise that in its current state ETPCR isn’t entirely suited for this sort of projection. The boost from being on a good team or playing on a bad team probably has too much weight at an individual level and it’s something I’ll look to address over the off-season.
I don’t necessarily want to discount the value of the team – average players on a good team will get better opportunities than similar players on a bad team – and being able to quantify the value of those players on a good team is important. But the quality of the players around individuals is having an impact.
An example of this is Isaiah Papali’i, who went from the being of the best second rowers in the game by this metric to to playing at a minimum salary level just by joining the Tigers. Clearly, he had regressed statistically, but it’s about finding the right line between individual performance and impact of those around them. There’s always an argument about who a defensive miss should be attributed, and edge players are usually paying for mistakes made inside them or covering for weaker defenders on their outside. I’d like to reduce how much that factors into their rating and reduce the cases like Papali’i.
Another thing I also noticed that I was probably too cautious in projecting the growth of players in their early 20s and too lenient on the decline of players in their early. The players who tended to have the biggest variance in projected and actual salaries were younger players (especially those moving to better situations) or older players switching teams or moving into reduced roles. Part of this also affected Walsh’s numbers, and I think having a more aggressive early development curve would reduce this problem.
The other change I would make for next season if I do this again is to represent players as worth a percentage of the salary cap rather an absolute dollar figure. It makes it digestible at a higher level and resolved any issues around changes in salary cap size. Minimum salary or minimum value players would still be represented as such, or at classed as 1% of the cap.
—
I wanted to end this post with some minor housekeeping notes. This will be the last post on the site this season, and I’d like to thank anyone who read, shared, liked or commented on anything I’ve posted this season.
I’d also especially like to thank those of you who’ve donated your hard earned money to the site. I’m grateful that I was able to provide something with enough value to you that you decided to give back your own value. Without your help this site wouldn’t eexist.
Site visits were are thirds higher this season and users are up over 80% with two months of the year to go, and the Eye Test continues to grow.
This comes despite the downfall of Twitter/X as a traffic source. Twelve months ago social media was the biggest driver of traffic to the site, but that’s changed this year and thankfully I’m getting views from direct and organic search. It’s nice to not have the success and visibility of the site tied to the whims of one person.
However there will most likely be some changes next season. I started a new job in January this year that is becoming far more demanding of my time, and trying to hit a weekly cadence of posts became very challenging as the season drew to a close. As much as I enjoy doing this, and as much as I’d like it to, this site doesn’t pay my bills.
The Eye Test will be back next season but possibly on a slightly reduced schedule. My aim is still to put something out weekly, but there might be parts of the season that may drop to fortnightly or even monthly depending on real world commitments. I have a few new things I want to try next season, and ultimately it will become an issue of time not desire to implement them.
One thing that definitely will change is trying to produce two posts per week during the last month of the NRLM season and the first month of the NRLW season. It wasn’t sustainable and is something I won’t be doing next season.
I’ll probably pivot to from NRLM to just NRLW content at that point next season rather than burn myself out doing twice as much with the very limited spare time I currently have. If by some stroke of luck I was able to do this full time that would change, but I can’t see that being the case anytime soon.
Again I’d like to thank everyone for their support this season, and look forward to your support in 2024.

