We are a week late with the Eye Test’s monthly efficiency updates due to scheduling in the mid-season advanced statistical leaders after Round 13. So, this week we have May efficiency update with the first week of June thrown in, as well as a look at what (or if) the Tigers might have improved up on under new coach Benji Marshall.
That’s an additional round included at no extra cost for your May(ish) efficiency update. There’s no shrinkflation here at the Eye Test where we understand the rising costs of living.
For new readers, the regular efficiency analysis is done by looking at the average actual points scored and allowed by each team and comparing them to their average expected points gained and conceded. It allows us to look at how much field position teams are using to score their points, and how possession they’re defending when they concede them.
There’s a full explainer on expected points for rugby league on the website here, but here’s the short version. By using the probability of scoring a try from a specific location of a play the ball on each tackle, we can assign an “expected” point value of what that play the ball is worth. Sum up each of those instances and you get a total number of points that each teams possession was worth for that game.
Another way of looking at it is that it is the value of the field position a team had, not what they did with it, which is why we track it against their final score. When we compare those two data points, you can see which teams are using the ball efficiently (scoring in fewer possessions or from further out) or taking too long to cross the line.
Round 14 saw one of the few times tackles inside 20 meant something as it almost mirrored the scoring – 53 to 16 for the Dragons against the Tigers. Below is the expected point chart for that game.

The Dragons came out victorious on expected points as well as on the scoreboard. On the back of 65% of possession and 66% of territory they accumulated 32.21 expected points whilst only allowing the Tigers 11.31 themselves. I’ll have more to say about the Tigers later.
I’ve posted the below chart previously, but it’s worth showing again. Generally, the number of play the balls inside 20 metres has a very minor positive correlation with winning games. It does influence a teams expected points total though as the closer you are to the try line, the higher the probability of scoring.

In another interesting coincidence, Round 14 was about to have every winning team also win the expected point battle until the Eels bottled a seemingly unbottleable win. Such is life as for Eels fans. Maybe the club should sack Brad Arthur again?
Moving on to the May(ish) efficiency analysis, first up we look at the average on field scores per team.

Looking defensively (vertical axis, lower is better) the Panthers still have the best per game defense at just points 15.4 allowed, slightly ahead of the Dogs at 16.2 per contest.
Canterbury’s defense has been tremendous all season and was something I highlighted back in April. They’re still a bit up and down with the ball for me to consider them a legitimate finals threat, but a spot in the bottom half of the eight and a possible week one finals upset wouldn’t surprise me in the slightest.
From those two it’s nearly a 3 point per game gap to a glut of sides starting with Cronulla allowing 18.9 per match. Then there’s another gap after Manly and the Dargons at the league average conceded of 22.7, with Canberra sitting in no mans land at 24.5 allowed, before the bottom five defenses who are all allowing at least 26.5 points per game.
Attacking wise (horizontal axis, further to the right is better), the Roosters lead the competition at 29.7 points scored per game, before another bunch of sides around 24-26 points per game. Below league average there’s the usual rabble with two notable exceptions – the Warriors (19.6) and Canterbury (20.7). The Wests Tigers are averaging just 15.6 per game, nearly half of the Roosters average and over two points per game worst than the 16th ranked attack (Newcastle).
Now let’s see what the expected point values are for each team.

This one looks very different. Defensively (vertical axis) the Warriors are the stingiest in terms of allowing high expected point value field position, only conceding 14.9 expected points of possession. Interestingly the Eels are the second best in the competition, allowing just 16.0 points of field position.
Parramatta’s performance here is a good example of why field position alone isn’t a useful indicator of performance, it’s what you do with the field position that matters and that’s why I’m provide this context.
The difference between the two sides is that the Eels give up 28.9 points per game, thanks to the Eels giving up the longest tries in the competition at an average of 35.7, almost 10 metres more per game than anyone else as shown below. Take note of the Tigers position on this chart for later.

The other obvious outlier here is that the Sharks give up the best field position in the competition, which is only sustainable if you rarely makes mistakes. And we saw what happens when that isn’t the case in their losses to Penrith and Parramatta, before they steadied the ship in their win over Brisbane.
The interesting part of that last win is that the Broncos only had 9.4 points worth of field position, a stark contrast to Cronulla’s performance on this chart and one of the lowest expected point values allowed this season. Maybe I didn’t jinx them with my post a few weeks ago?
Now we’ve established both actual and expected for and against, now we combine them together to provide the context I’ve just given above. This chart is split into four quadrants, indicating whether a team is dominant (above average actual scoring and expected points), efficient or lucky (above average actual scoring but below average expected points), inefficient or unlucky (below average actual scoring but above average expected points) or just plain incompetent (below average scoring in both).

This paints a clear picture of how teams are tracking with the ball. We only have two clearly dominant attacking teams in Penrith and Cronulla, with the Dragons and Cowboys straddling the borders of this area. The Warriors are less than 1 point per game from being dominant as well, which is why I’ve also used the unlucky label on the bottom right quadrant they sit in. The closer you are to the dominant quadrant the unluckier you are, and the closer you are to the incompetent quadrant indicates how inefficient you are. Given the randomness of some try decisions, luck certainly plays a part.
Also occupying that inefficient/unlucky space are the Knights, who are clearly incredibly inefficient this season, and three teams that are nearly identical with the ball. South Sydney, Parramatta and Canberra have nearly identical attacking efficiency but of them is inside the top six, the other two have been terrible.
The efficient quadrant has the usual suspects here, led by the Roosters. Then in the incompetent area, we have the Gold Coast, whose last month of progress was wiped away with a terrible loss to Souths and as usual, the Wests Tigers.
On to the same chart as above but by points allowed and expected points yielded.

The dominant quadrant is still mostly owned by the Warriors, who have controlled field position to an incredible level this season. Penrith are still doing Penrith things even without their best 17 available, and the Bulldogs aren’t far off that mark either. The hallmarks of the Cleary coaching tree, having three of the best defenses in the NRL this season.
Melbourne have quietly been putting together a strong defensive season, even if they’ve had a few lucky wins to boost their ladder position. The fact they can continue to be strong defensively without their spine intact bodes well for late in the season when (or if) they’re healthy.
The efficient quadrant shows how well the Sharks have been doing at defending their line for most of the season, only allowing 18.9 points per game from their league leading 22.1 expected points per game allowed.
Parramatta’s inefficiency on defense is very obvious here, allowing almost 29 points per game on just under 16 points per game of field position. They’re in a spot that no other team has been in over recent seasons.

Cowboys fans will cringe at how bad they appear on this chart, occupying similar territory to the Bunnies and Titans. As I noted early in the season this style of play is incredibly unserious and whilst it might catch a few teams by surprise, as they did against the Roosters in Round 13, but it’s not sustainable nor built for September.
Next, we’ll look at the percentage difference between actual points for and against compared with expected points scored and conceded. It’s quick way of noting just how far the gap between expected and reality is for each side.

The Roosters have been tremendous with the ball this season, scoring 81% more points than an average team would with the same field position and possession. Brisbane, Melbourne, THE Dolphins and Manly are all scoring at least 30% better than expected as well.
You will not that even though the Sharks and Panthers were dominant on the prior chart, they’re not scoring more than expected at the same rate as the efficient teams, at 27% and 6.5% respectively. This is an indication of both sides winning the possession and territory battles, scoring after longer build ups or from closer to the line. Again, the context matters here.
At the bottom end of the scale, there’s only three teams that score less than expected. The Warriors (which isn’t as much of an issue considering how dominant they are defensively), Newcastle, and the Tigers, who for yet another season lack the ability to finish sets that end up close to the line.
Defensively there isn’t much surprising here either.

The top sides are as expected. Canterbury (-16%), Penrith (-15%), Cronulla (-14%) continue to dominate, with the Roosters (-5.6%) also allowing fewer points than expected. It’s hard to see anything other than another Penrith appearance in the Grand Final, with the rest of the league having somewhat of a mid-off and no clear rivals emerging yet.
At the top end, the Eels have been woeful, giving up 83% more points than their territory allowed suggests. They might have looked better against Cronulla but their issues reared their heads again against the Bulldogs. Souths should be grateful for the Eels performances, as their 61% more points allowed than expected doesn’t look as bad, even though it’s shameful.
The Tigers place third worst on this chart at +45%, which is also terrible (remember that a lower number is better here).
Which brings me to these Wests Tigers. If you were to show me these charts in a vacuum, I’d not even believe there has been a change in coach this season, or probably even in the past two seasons. Have they improved in any way in 2024 under Marshall’s leadership?
The answer is generally no, they’ve been just as bad as they were under Tim Sheens and even Michael Maguire. Here is the Tigers percentage of points scored against expected points gained for the past nine seasons.

The last three seasons up to Round 14 are virtually indistinguishable. -16%, -13% and -14% this season. That’s with three different coaches and three wildly different spines.
Defensively it’s more of the same.

+46% in 2022, +50% in 2023 and +45% in 2024. Are we sure there has been a coaching change in the last three seasons? Or any change? The net results of their performances suggests things are just as bad as ever. At least they’re consistent I guess?
If we go back to the expected versus actual charts with quadrant labels, it paints a similarly bleak picture.

In attack, they’ve only had two seasons above league average (2020 and 2021), which came when everyone was scoring points. And even then they were still very close to league average. Their 2024 output is actually nearer to 2022 than 2023, which is terrifying when you compare the lists from each season.
Defensively they’ve only had one season better than league average (2018), and whilst 2024 isn’t sitting in the incompetent quadrant, it’s still one of their worst defensive seasons in the last decade.

Across the whole season, the Tigers haven’t had a single minute this season where they’ve held a positive margin.
The best being the first and fourth minutes, where they are even on average. From opening whistle it’s a constant downward slide to the average -11.4 point margin after eighty minutes.

Like the Eels, there’s a tipping point in the second half. At the 56th minute where their average margin doubles, but they haven’t had the luxury that the Eels had in having a positive margin when it happens. Even the 2023 Tigers managed to claw back from an -8.7 margin to -3.6 in the last 20 minutes. This years Tigers just fold like a house of cards when too much pressure is applied, which is more akin to their 2022 average margins.
Splitting that into the amount of time spent in front, behind or tied on the scoreboard looks equally as dire.

The Tigers have spent just 19.6% of minutes this season ahead on the scoreboard, with most of that coming in their Round 3 win over Cronulla. That number is the lowest in the competition, and unsurprisingly the two thirds of time spent behind is by far the highest in the NRL. Gold Coast are the only other team to have spent more than 60% of time behind, and Souths and North Queensland are the only other two above 50% of time trailing. Meanwhile, Penrith and Brisbane have both spent 60% of minutes ahead, with the Roosters and Manly above 50%.
Part of the reason this happens is that the Tigers give up the best starting positions in the competition.

On tackle one, Tigers foes are playing the ball 40.5 metres downfield. The team that dropped a Scott Bailey on them on Friday evening are the only other club that allows teams to play the ball on first tackle at least 40 metres from their own try line.
Even if we remove sets started inside 20 metres, the Tigers still give up the most at 31.5 metres.

Of course this isn’t a reason for poor play on it’s own, as Parramatta are the best in the competition by this metric thanks largely to Mitch Moses’ kicking game.
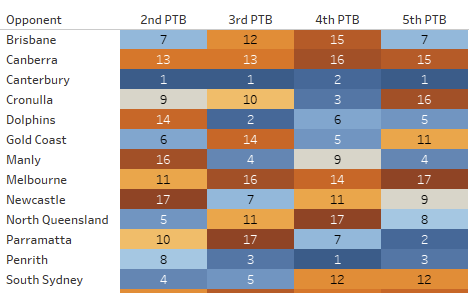
What makes things harder for the Tigers is that they don’t generate enough yardage. Below is the rank of each team’s metres past the play the ball for tackles 2-5 this season. Blue is good, orange is bad.
And that’s a lot of Orange for the Tigers. They rank outside the top eight on each of these play the balls, last on third tackle, and in the bottom five on tackles two and four.
One of the reason they don’t generate early metres in sets is because their back five, and specifically their centres don’t generate enough metres.

Just 13.0% of all run metres by the Tigers this season have come from their centres, only ahead of Melbourne and 3% below the NRL average of 16%. I noted earlier in the season how centres are making as many runs as props are this season, making it even more vital that your #3 and #4 are strong in yardage situations. Justin Olam might be a strike weapon close to the line but he’s not helping out of their own end of the field.
Even if you add in their back three, who contribute 27.4% of total run metres, which amounts to 40.4% which is third worst in the NRL. The Panthers are #1 with almost half of their metres from their back five, with 34% from their back three alone.
This in part puts more pressure on their middles to make metres, and they don’t generally do that.
It is something I wrote about four seasons ago, where the Tigers had very few forwards in the upper quarter percentile (75%+) for almost any run metric. Josh Aloiai was their best forward for metres per run and he was only in the 67th percentile. Other than that it was current Cowboys middle Thomas Mikaele.
Fast forward to 20240 and it’s the same issue now. David Klemmer, Stefano Utoikamanu and Fonua Pole are best forwards for the Tigers by metres per run, and their percentile ranks are 72nd, 68th and 64th respectively. There’s no forward at the club who is elite at consistently churns out longer runs, they’re all gaining metres by accumulation of shorter runs. Death by a thousand cuts
Whilst they might not be generating metres themselves, one area I could find that they have improved up on under Marshall is restricting metres early in sets. Below is the same chart as previous showing metres past the play the ball per tackle, but this time by opponent instead of team.
The Tigers rank first in the NRL for metres past the play the ball allowed for the second tackle. The skeptics among us will claim that’s because they’re allowing teams to start 40 metres out and their defensive line has less distance to travel to prepare for yardage runs at the start of a set.
That might be true, but they’re allow the third fewest metres on tackle four, and are ninth and seventh for tackles three and five. So there is definitely one area the Tigers have improved on. Last year they were 17th for metres past the play the ball on tackle two and 11th on tackle five.
But as noted above if you can’t generate your own metres eventually teams will eventually end up close enough to score. And with the Tigers prone to some of the most basic defensive lapses you’ll ever see it’s impossible to stop the dam from breaking. We saw that above as they’re fourth worst in the NRL for average try distance at 24.9 metres. But for basic yardage defense the club has improved there.
It’s not valuing possession that is a problem for the Tigers, as they have one of the lowest error rates in the NRL. Their discipline isn’t bad either, as we saw a few weeks back the club is about mid table for average penalties and set restarts received per game. Where they concede them or the type of infringement might be more of an issue, with the Tigers opponents having fourteen penalty goal attempts this year, the highest in the NRL.
Interestingly Canberra has had zero penalty goal attempts against them this season, something I could only occurring twice in the past decade this late in the year, both happening in 2022 (Penrith and North Queensland).
These numbers aren’t meant to form a consensus Marshall’s coaching ability this early. The club showed some promise in Round 3 with their demolition of Cronulla, in what now looks like a complete aberration. Marshall is a rookie coach with the toughest gig in the competition and is also dealing with a substantial list of unavailable players, including most of his veteran forwards. He’s also doing it a year ahead of schedule, as the game had passed Tim Sheens so much that he wasn’t viable for 2024, and Marshall ahd to step in early. Not many would be able to succeed under those circumstances, let alone with the albatross of the clubs recent history attached to them as well.
It’s not looking promising right now, but this was always going to be a rebuilding year as the club needs to cycle through previous recruitment mistakes, similar to Canterbury’s 2023 season. It looks like that might be happening earlier than expected with reports of Brent Naden and Jayden Sullivan heading to the UK shortly. Marshall doesn’t have the pedigree Cameron Ciraldo had, but it does show that it’s incredibly hard to implement your vision if you don’t have the right pieces to deliver it.
As much as this year paints a negative picture, there’s still light at the end of the tunnel which couldn’t be said of prior Tiger seasons. The obvious one is Jarome Luai arriving in 2025 and his presence should finally give the club someone who can execute with the ball close to the line. He’s also being joined by Sunia Turuva, which gives them another attacking option that they desperately need.
The 2024 Tigers average more general play passes per game than every club other than Manly, and have more line engagements per game than any other team, per Fox Sports Stats. The problem with this style of play is that you need players who force defenders to commit, and they don’t really have those type of players (yet). Currently their opponents can just hold their line and put the onus on the Tigers to go around instead of through them. There’s no threat right now, and the result is the woeful attacking efficiency charts we saw above.
On the positive side, the Fainu brothers have shown glimpses of brilliance along with the expected growing pains of young players. Fonua Pole continues to improve, and union convert Solomon Alaimalo has had some bright spots as well. Lachlan Galvin has looked tremendous as well, and despite (mostly likely agent driven) stories about him wanting out Shane Richardson has doubled down on his commitment to keeping Galvin and focusing on their juniors.
The young players they’ve had to blood over the past 18 months will be better for the experience and the club will be better for it next season. These sort of turnarounds take time and it’s good that Richardson seems willing to allow it to occur at it’s natural pace rather than look for a quick fix.
However, the goal shouldn’t be to become respectable, it should be to become successful. From what we’ve seen this season they’re still a long away from the former, let alone the latter. But the target isn’t this year, it’s next year. Hopefully for Tigers fans I’m not writing about this again in 2025.