With the NRLW regular season completed and finals starting this weekend, it’s time for and Eye Test efficiency update. And like the NRLM, the women’s competition this season featured a pretty obvious gap between the top four and the rest of the league, although Parramatta tried to make it competitive and sneak into fourth spot.
Even within that top four, there’s another stylistic gap between the top three NRLW sides and Cronulla, which we’ll examine in detail later.
First up though we’re going to clarify the methodology. As usual, we’re comparing on field performance by way of average points scored and conceded against each team’s expected points averages. The expected point model used on this site is based on the probability of scoring a try from the location and tackle number of each play the ball during a match. There’s a full explainer if you need more details on the site here.
These updates are a useful way to look at which teams are making the most of their field position, or seeing which ones need more possession close to the line to generate points. Cronulla, I’m looking squarely at you.
Defensively the same applies. We’ll be able to pinpoint which sides are letting in points from areas that don’t usually have a high probability of producing points, and which teams are defending their line well against a barrage of attacking play.
First up we’ll set the scene for on field performance by looking at the actual scoring by team this season, plotting average points for versus average points against. All data is from the completed nine rounds of the NRLW 2024 regular season.

There’s quite a clear delineation between the top four sides and the bottom six. Each of the top four sides conceded fewer than 18 points per game, while the bottom six sides all conceded at least 18 points or more.
Canberra was the only non top four side to have a higher than league average attack at 21.6 per game, above the league average of 19.8 points scored per contest. Cronulla also had a worse than league average attack, only scoring 16.2 points per game, the only top four side below that mark. Given that number includes a 40-0 loss to the Roosters, their defense in the other eight games they played in 2024 was remarkable.
Next we’ll check out each side’s expected point gained and yielded per game. As I’ve noted in prior efficiency updates, it’s probably better to think of this as the value of field position than what the final score could have been.

There’s a few takeaways here. Brisbane and Parramatta give up similar field position, both averaging around 20.3 expected points conceded per game, but the Eels generally have better field position with the ball (18.9 vs 16.5). However as we’ll see later the Broncos do a lot more with their limited possession, whilst the Eels couldn’t convert enough to keep them in finals contention.
Part of the Broncos higher possession value from expected points is that they allow their opponents to start their sets 43 metres downfield, the highest number in the NRLW this season.

Both Newcastle and the Roosters average fewer than league average for expected points conceded, while the Knights also average less expected points than league average with the ball as well.
The Gold Coast had the best field position in the NRLW this season, averaging 22.2 expected points per game, and give up the third fewest expected points per game at 16.9. Yet somehow they’ve ended up in eighth spot with a 3-6 record and -62 point differential.
For the next chart we’re going to combine actual scoring with expected scoring on a per game basis. Each quadrant is labelled depending on whether or not a team is above or below league average in either metric.

We have just the one dominant team in the NRLW this season, and unsurprisingly it was the Sydney Roosters. Teams that sit in this quadrant usually have a high point scoring average along with high percentages of field position close to the opponent line. As we’ll see later with their heat map of play the balls, the Roosters spent a lot of time in the middle of the field when attacking.
Brisbane and Newcastle leaned more towards the efficient quadrant, indicating they’re scoring points from positions on the field that don’t usually result in high expected point values (ie further away from the try line). Canberra also sit in this quadrant but are much closer to the periphery of it, but their issues this season stemmed more from the opposite side of the ball.
The Tigers and Cowboys have staked a claim in the incompetent quadrant, which given the Tigers ladder position shouldn’t raise any eyebrows. The Cowboys had the third lowest attack this season, and their expected point average indicates they’ve been unable to get close to the try line on a regular basis.
The inefficient quadrant houses the Sharks and the rest of the sides that missed the finals. Cronulla was only marginally better than North Queensland at crossing the line on a per game basis (16.2 vs 15.2 points per game), but averaged nearly four expected points more per match.
When you look at how far from the try line that the play the ball resulting in a try occurred, you can see just why the Sharks were so inefficient.

Cronulla were third last at just 13.4 metres, indicating they needed to be far closer to the line on average than any of the other top four sides. They only placed ahead of the Tigers and Eels at 11.8 and 11.7 respectively, while both the Roosters and Broncos averaged over 19 metres per try, with the Knights at 16.6.
We’ll now look at the same chart but from a defensive standpoint.

Again the top for sides have clearly distanced themselves from the rest of the competition. The Knights and Roosters have been dominant defensively, allowing fewer than league average points per game and fewer than league average expected points per game. Only the Dragons allowed fewer expected points per game, but allowed more than 10 points per game than either of the top two defensive teams.
Brisbane and Cronulla’s defenses were more efficient this season, giving opponents field position which had a high probability of scoring points, yet allowing fewer than league average actual points. Again we can see how the Eels had a near identical value of field position allowed to the Broncos, but conceded at least three points per game more. That gap was probably the difference between finishing 4th and 5th for the blue and gold.
Interestingly the difference in average try distance conceded wasn’t that much between Brisbane and Parramatta. The Eels gave up a try on a play starting 17.1 metres from their own line, whilst Brisbane did so from 15.5 metres. You’ll see the Sharks having the best number here at just 10.8 metres out for the play the ball prior to a try being scored on them, and I’ll expand on this number a bit later.
North Queensland and Canberra were virtually identical defensively this season, both conceding 24 points per game on 18.4 expected points of possession. There’s definitely a bit of unseriousness about the NRLW Cowboys to match their NRLM counterparts, but as Liam noted in the Maroon Observer the club is at least headed in the right direction and can take away a lot of positives from this campaign.
For the rest of the league, the Dragons, Tigers and Titans were all inefficient, allowing higher than league average points per game whilst keeping opponents further away from their try line than league average.
Lastly we’ll convert the prior two charts into a percentage of points scored or conceded above or below expected. Firstly we have points scored above expected (higher is better).

There were four teams who scored double figures more than expected, three of the top four sides plus the Raiders at +38%. The three top four sides all scored at least 50% more than expected, with Brisbane at +83.7% and Newcastle at +78%. Both sides routinely showed they could produce points from outside their opponents 20 metre areas.
The other top four team in Cronulla were -19% against expected, meaning they scored 19% fewer points than an average team would with the same field position. They managed to combat their inefficient attack with a stingy defense, even accounting for the 40-0 thrashing they received against the Roosters in Round 7.

Defensively this chart shows how strong the Sharks were defensively (even with giving up that 40 to the Roosters), allowing 26% fewer points than expected than an average team would faced with the same opponent field position and possession. The Roosters and Broncos are also well into the negatives here, at -17.9% and -14.6% respectively, but the Sharks were on another level defensively this season.
We noted above that Cronulla had the shortest average try distance allowed this season at 10.8 metres, and that number would have been just 8.6 metres out if you take out their blowout loss to the Roosters. No other team was below 14 metres this season, emphasising how good the Sharks were at limiting long range tries.

Their final this weekend is against Brisbane, who we established had the most efficient attack in the league, and scored a try on average from 20.2 metres out, one of just two teams to average more than 20 metres for this metric. They may not get as many chances to get their line set whilst defending, as Brisbane have a propensity to create gaps further down the field than the Sharks are used to.
The Roosters game may serve as a blueprint, who scored on average 15 metres out in their round seven match, over 4 metres higher than the Sharks season average. Only Newcastle had a higher average against the Sharks this season at 15.6. The Broncos only managed to score on average from 9 metres out when they played the Cronulla this season. Improving on that without Stacey Wakaa is going to be challenging.
The Sharks, Roosters and surprisingly the Dragons were the only sides this season not to have a try scored on them from their own half. In fact Cronulla only conceded three tries all season that started outside their own 20 metre line. The other top four sides had at least five each.
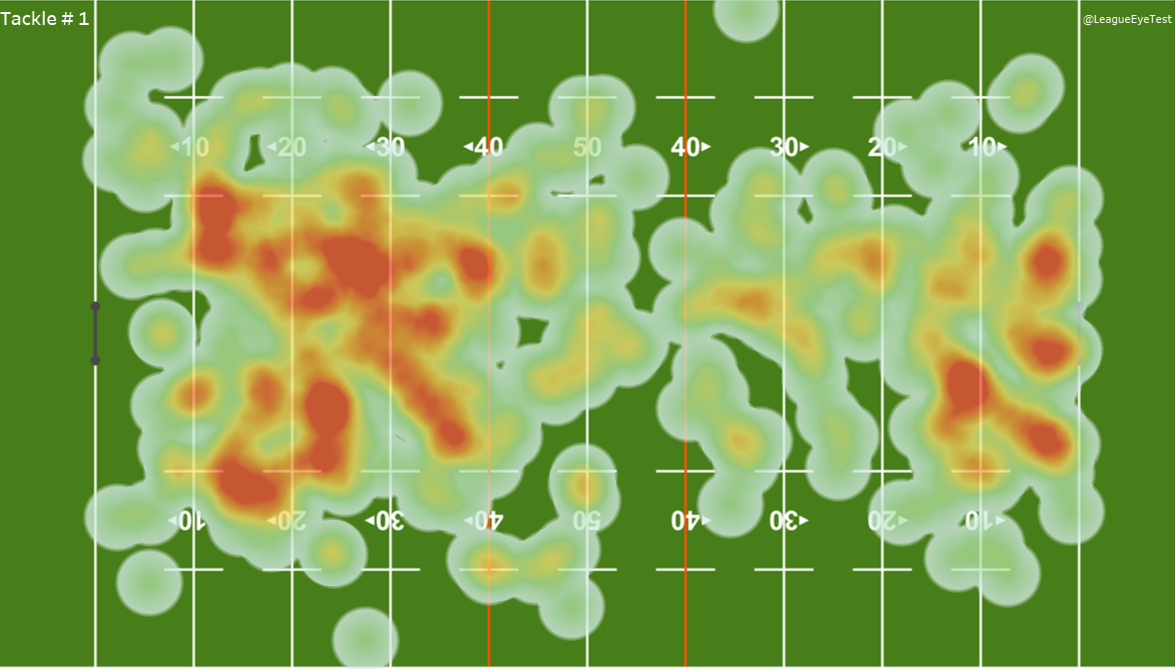
If you look at their heat maps of play the ball locations, you can see just how different both sides are.


The Sharks have a huge high intensity area in front of the posts, highlighting how much time they spend there with the ball. And when they do attack inside 20 metres, most of it goes left. Conversely the Broncos highest intensity areas are right around the middle of the field, as they set up for shifts to their dangerous edge players.
These numbers aren’t that surprising. Cronulla has the lowest percentage of play the balls outside of the middle third of the field at 34.4%, while Brisbane isn’t much better at 37.9%.

Back to the defensive percentage against expected, Newcastle appears the most shaky defensively, allowing 2% more points than expected which is the worst of the top four sides. However the Knights allow the second fewest expected points in the NRLW at just 16.1 per game. That +2% is not the same as +2% would be for a team like the Broncos, who as noted previously allow over 20 expected points per game, vying for the highest amount with Parramatta.
For Newcastle to be successful this weekend they’ll have to withstand a barrage of Roosters attack inside 20 metres, whilst producing some of the longer range tries they’ve created during the regular season. They should be prepared for a steady stream of possession in the middle of the field in attacking areas, as shown by their heat map of play the balls below.


Newcastle don’t spent a huge amount of time inside the 20 metre zone, while the Roosters tend to set up either side of the posts. They also focus more of their runs in their own half down the right edge, whilst Newcastle tend to be more left side dominant. As shown above, the Knights tend to use the edges of the field more than the Roosters at 39%, with the tricolours play the ball on either edge 36% of the time.
Interestingly teams facing the Knights only run down the edge of the field 30.2% of the time, facing just under 70% of play the balls in the middle of the field.

That number is the lowest in the NRLW, whilst Cronulla sees the highest proportion of play the balls down an edge at 38.9%. Newcastle’s opponent in the Sydney Roosters have the second lowest amount of play the balls down either edge at 33.1%, indicating their final will be most likely played between the tram tracks, even if it’s won outside of them.