There’s nothing like a round of blowout results to fire up the rugby leauge hot take and crisis merchants. Everything needs to be fixed, it’s an embarrassment, code in crisis etc. This line of thinking would have to complete ignore the start of the NRLW season including a fantastic game between the Knights and Broncos on Sunday evening.
Yes, NRL Round 23 ended up with the highest average winning margin after 80 minutes since 2014 when I started tracking this sort of thing. That average winning margin of 32.3 points per game was nearly 6 points per game than the previous highest of 26.6 in Round 16, 2021 from a season that was full of ridiculous results.
Thanks for reading The Rugby League Eye Test. Subscribe below to receive new posts in your inbox
I had noted on Twitter on Saturday evening that this was almost assured of happening before Sunday’s games were played.
As it turned out, the Knights v Raiders game would have needed to be decided by negative 43 points to not claim the record of the highest average winning margin of a round since 2014.
Surprisingly that did not happen.
Was this an abberation? Should this slew of blowouts been expected?
I can’t move forward with this and not mention friend of the site Adam Pengilly winning the bad timing award for 2022 with his article on the NRL possibly solving its’ blowout problem being posted on the Sydney Morning Herald site at 7:37pm on Friday evening. It’s a shame that it ended up as a meme post because the article contained some great analysis.
Going back to the weekend’s results, first we’ll answer the question of should this have been expected? Were these games lopsided going in? Ignoring the betting markets for this and just focusing on ladder position and points for, against and margins. Here’s the list of the top 20 rounds by average winning margin since 2014.
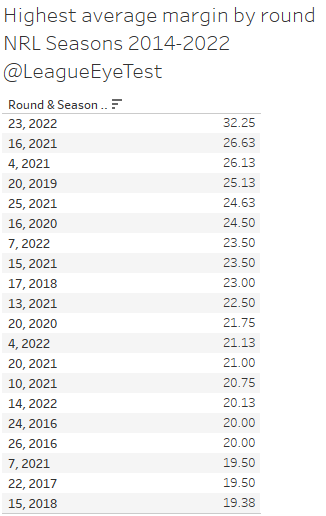
Only six of the highest 20 rounds for average winning margin occurred before 2020 when there was a major change to the games rules. Seven of the top 20 come from the 2021 season, two from 2020 and three from 2022.
Nine of those occurred in the final five rounds of the season as well, with the 2016 season having a very one sided end to the competition with both Rounds 24 and 26 having an average margin of victory of 20 points per game.
This should tell you that the idea of this being new or a bigger issue now is nothing more than the usual media beat up. Teams have always been bad and have always had less to play for at the end of the season. The result is that you get some very one sided outcomes with these dead rubber games.
Just for fun, let’s flip it around and look at the lowest average margin by round since 2014.
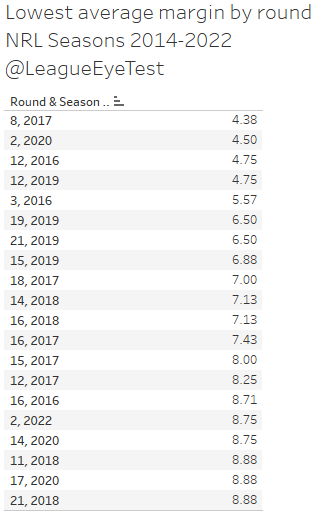
There’s just four instances inside the top 20 closest rounds occurring after 2019, and one of them was Round 2, 2020 before COVID changed everything and set restarts were introduced in May of that year. Interestingly the 2022 season has one of the top 20 rounds for closest average margin. In a great example of recency bias running wild, no one remembers that Round 2, 2022 had teams winning by an average of just 8.75 points, which I’d noted earlier in the season. We’ve had one of the lowest average margins and one of the highest in the same season. Isn’t that an indication that what we have is working?
Back to Round 23, Here’s the breakdown the weekend’s margins by minute compared to other rounds, and specifically the previous high mark of Round 16 2021.

If you look at all the average margins of rounds from 2022 compared to the past six seasons, it’s even more clear that this is a huge aberration and most rounds from 2022 have been relatively close and those that ended up with wide gaps in scores did so towards the end of games.

Up until the 30th minute the scores were quite consistent with other rounds and there was very little scoring between the 30th and 38th minutes. Even on the past weekend, whilst scores were high they really didn’t get out of control until 55 minutes had passed.
Claiming that a draft would solve these issues is a nonsensical idea. The idea that you can legislate incompetence out of the game is laughable. A draft doesn’t instantly solve these issues because teams still need to draft well. Anyone following US sports with a draft will instantly be able to identify teams that have consistently been bad because they’re unable to draft well.
A draft doesn’t eliminate bad decision makers, poor player scouting or talent identification. If anything, a draft puts even more pressure on teams to make a good recruitment decision. In the current situation, if a team like the Tigers wanted to sign 4-5 high quality off contract first graders, they could go out and do so. Under a draft system they’d have one opportunity to pick a player and then wait until it was their turn again. It would be highly likely that under a draft the Tigers wouldn’t have been able to acquire Api Koroisau and Isaiah Papali’i (touchwood) in the same off season.
You could argue that the Wests Tigers are the Sacremento Kings of the NRL. The Kings have been terrible for over a decade, have drafted poorly and missed on some of the best players in basketball by taking the wrong player despite having consistently high draft picks. No recruitment system is going to help a team that can’t identify talent more often than not.
It’s not a fool proof system and rugby league is a sport that generally attracts a lot of fools. You can’t claim a team like the Dragons are “moneyballing” the NRL early in the season and then turnaround and claim the sport need a draft because they’ve signed a number of players that teams were willing to pay to get rid of.
A change to a draft system would also take at least 2-3 seasons to flow on to on field results as well. One or two high draft picks aren’t likely to turn things around when you have thirteen players on field. It can change things more dramatically in a sport like basketball where you only have five players on court and one superstar can change a teams’ fortunes. Finally you can’t promote a draft whilst also peddling the narrative that there aren’t enough players to support expansion. Pick your side.
Now we’ve established that this isn’t a new phenomenon and there’s always been rounds with one sided games – especially late in the season –let’s take a look at whether or not ladder position influences the amount of points scored in a game or the average margin of victory. Do close games (eg second versus fourth, or 12th v 13th) have closer outcomes? And just how big are the scores in games with larger ladder discrepancies
First let’s take a look at the average margin of games between each ladder position. This analysis numbers excludes any Round 1 games as no ladder positions are available. All ladder and scoring data is taken from the wonderful Rugby League Project, please support them as it is an invaluable rugby league resource.
Below is a correlation matrix showing the average score for every combination of ladder positions from the past eight NRL seasons. Lower average scores are show in orange up to higher scores in blue, and the darker the colour the closer the number is to the end of each range. The diagonal line of white boxes shows games that cannot occur (eg 2nd v 2nd).
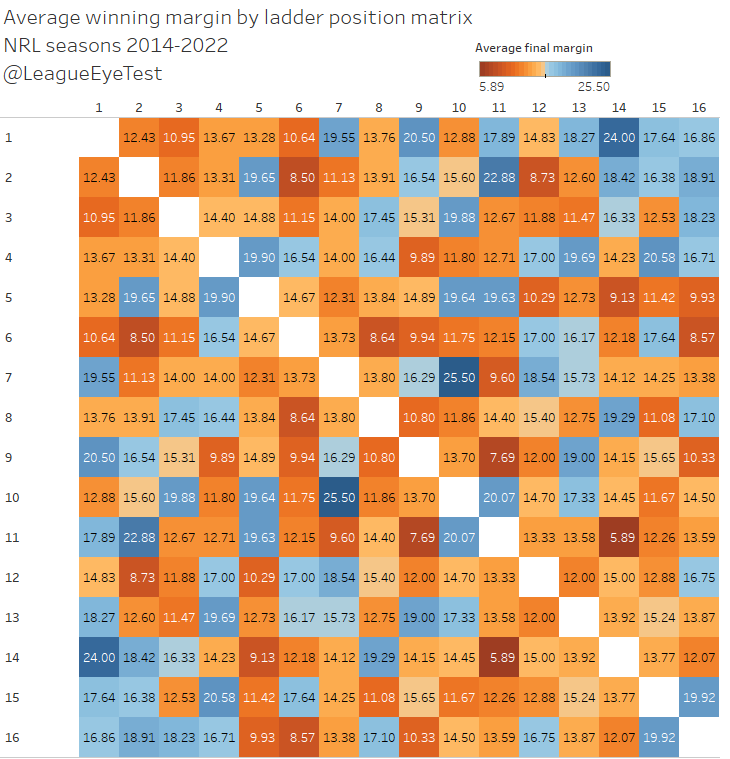
There’s a few things that stand out here. The top right and bottom left corners show that generally a game between a top four side and the the 13th-16th placed teams will produce a higher margin. For example, if we look at the top row, 1st v 14th has an average margin of 24.0 points.
The other thing that’s clear is that games between teams similar on the ladder – those close to the diagonal line of white boxes – generally have lower average margins. For example, 9th v 11th has an average margin of just 7.69 points.
This doesn’t’ always hold true though. A matchup of positions 7 v 10 yields an average margin of 25.5, the highest in this dataset. Similarly, a game comprising of second v twelfth produces an average margin of just 8.73 points, almost one third of what you’d expect in second v 11th (22.88).
There’s enough outliers in this matrix to show that ladder position doesn’t always procude the anticipated result.
So now we know what the “expected” scores are for these, did Round 23 produce anything out of the ordinary?
The majority of the matchups this weekend were reasonably close. North Queensland (second) versus the Warriors (thirteenth) was the biggest gap, with four of the eight games having a difference on the ladder of five or less.
The average ladder difference for Round 23 was 5.8, which ranks in the 80s out of 200+ rounds we’ve had since 2014, or about middle of the range. Going from the above matrix of averages by ladder matchup, the expected average margin of those games is 15.5 points, which sits about 40th out of the 200+ rounds.
We ended up with 32.3, 107% higher than expected. That’s just ahead of Round 16, 2021 where the actual beat the expected margin by around 90%. No other round has had a percetage of actual over expected higher than 60% and only a handful have had it over 50%.
Here’s a plot of all actual averge margins against expected average margins, which again highlights how much of an outlier this week is.
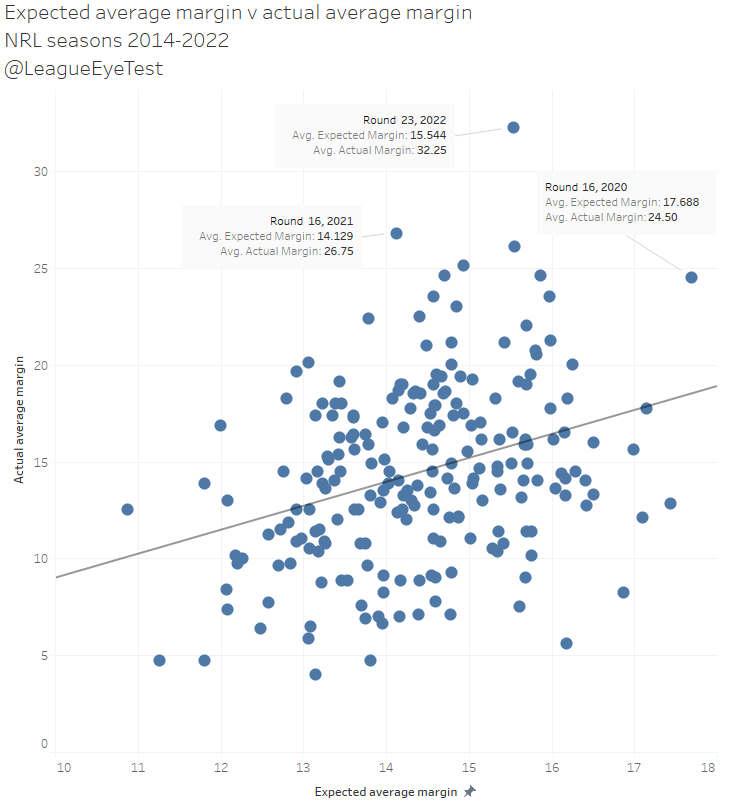
Interestingly the previous high mark of Round 16, 2021 wasn’t that much higher of an outlier. Round 16 2020 was far more of an outlier, in that it had a high expected average margin and a high actual margin.
Again, this is an anomaly, not a regular occurance. Freak results like this happen on a weekly basis, just not all of them at the same time.
The big takeaway from this analysis is that there’s very little correlation between the difference in ladder position of teams and the final margin. Here’s the plot of every regular season game since 2014 by final margin and ladder difference.
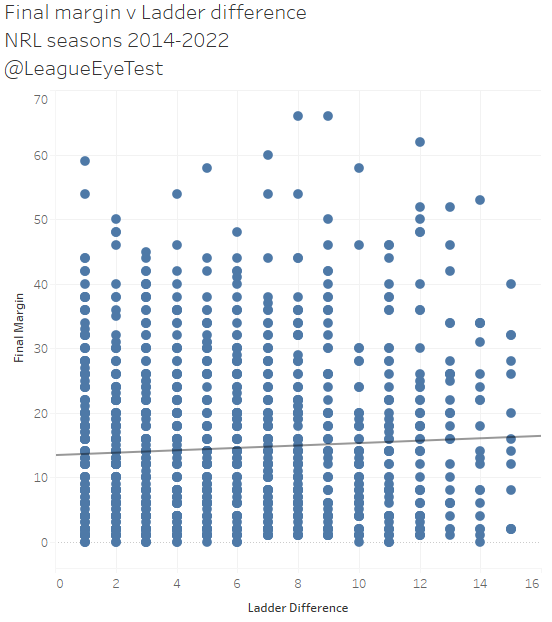
The r squared of the above data (how well the model explains the observed data) is 0.0031. which means it has basically zero correlation between final margin and ladder difference.
There’s a number of reasons why we had such large scores on the weekend – players available, finals positions basically locked in, teams with nothing to play for. These aren’t new phenomena; they’ve existed for decades and will for decades more. And these type of abberations will continue to happen, but probably not all at the same time as we saw in Round 23.
What is also not new is the overbearing reaction to these results from the dinosaur media that feels it’s job is to frame the narrative of the game.
That is the only thing that needs fixing.
If you enjoyed this post please consider supporting The Rugby League Eye Test through one of the links below.
[crypto-donation-box type="tabular"]


Very interesting analysis. What I would really like to see is a correlation between 6-agains (particularly in the first 20 min.) and wins, as well as scorelines. If there were a way to then further correlate when in the set and where the 6-agains were awarded it would be an interesting analysis.
Furthermore, an analysis as to whether “even-up” calls gave the potential for a comeback.
I simply would like to see if there were a way to determine whether the 6-again rule has had an impact on the game, and how great an impact that may be. It seems to me that the first 20 min. of games are crucial, and if multiple calls go in one direction in this time, it spells “Game Over” for the offending team.
It is unfortunate that stats are incapable of actually dictating whether the penalties are legitimately and/or fairly/consistently awarded. However, in games where 6-again calls are skewed to figures like 6-2, it seems unreasonable to think that one team is not infringing compared to the other team.
Thanks again, mate.