Last week on the site I noticed that in Round 1, NRL teams were playing slightly wider than they were in previous seasons. This week I’m going to have a slightly deeper look as to why that is happening, which teams are driving it and where the changes are happening on field.
Before we get into that, a few quick plugs. Friend of the site AJ Mithen has his usual great recap of all the big talking points from last round on the Roar, with a look ahead to this weeks upcoming games if you need to catch up on anything you might have missed, like the try of the decade. Also another friend of the site in Elliott Richardson has launched The Game Plan Pandemic, delving into the styles of play in modern rugby league. Please check it out and continue to support independent rugby league content.
Back on track – so did this width revolution continue this week? Yes and no.
When you look at an aggregated league wide view, the width revolution appears to be diminished in the second round. There was more running through the middle of the field this week than last week, and the percentage of play the balls by 6.8m grouped width was more in line with last year, as you can see below.
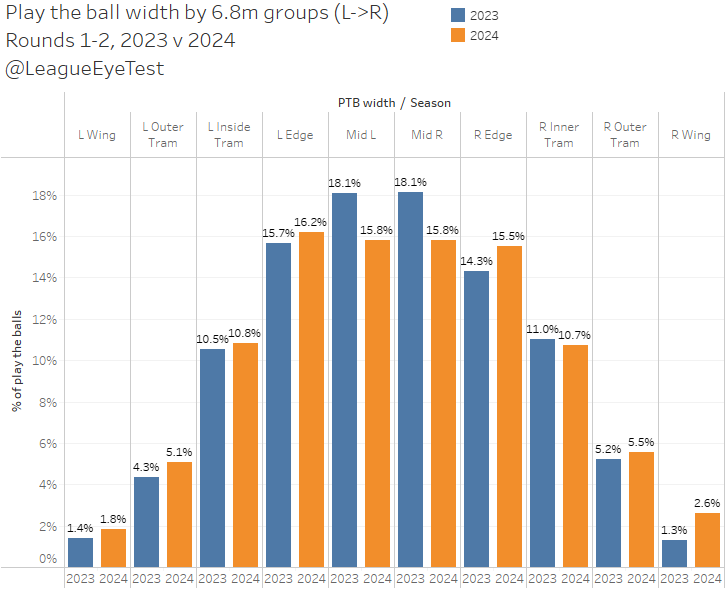
Still some increases on the left but not as pronounced as last week. That would appear to be a no.
But here’s the yes – there are a number of teams who are playing wider this season. It’s just offset but some who are still concentrating down the middle.
Let’s take a look at a few team specific examples. Please note that some of these are low numbers, so they’re more indicative than representative right now. In a few more weeks we’ll know more but from watching games you can see the trends emerging.
Canberra is an obvious one, who have an obvious reason for going right more this year. They’re currently leading the ladder, so it’s clearly working for now. Here’s their percentage of play the balls by channel year on year for the first two rounds. Here’s the same play the ball width chart from above but filtered to only Canberra this season.
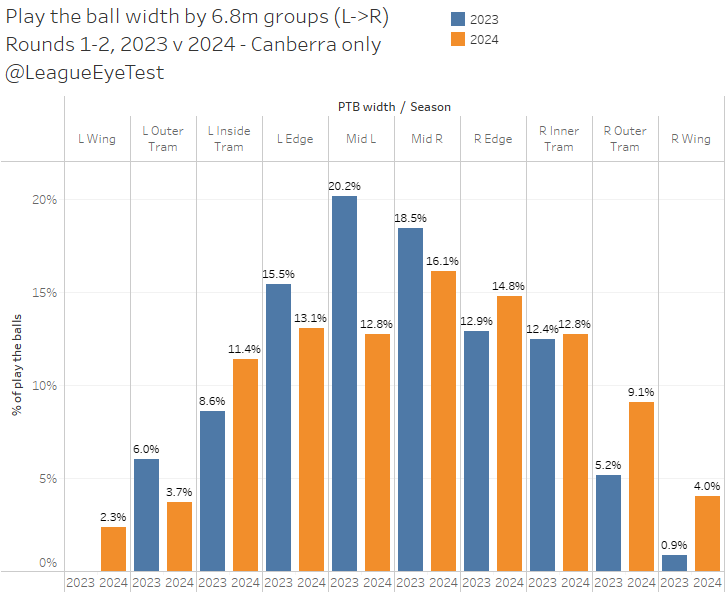
They’ve had 4% more play the balls on the right inner tram tack, and 3.5% more on the outer tram track, and another 2.2% more on the right wing. That’s almost 10% more play the balls on the right hand side of the field this season.
Obviously, this is happening because of Jack Wighton moving onto the Rabbitohs. The Raiders are clearly funnelling more ball down Jamal Fogarty’s right hand side. With the two results they’ve achieved so far and sitting on top of the table, you’d have to think it will continue until someone proves it can’t work. It’s a clever way of bringing Ethan Strange along slowly, giving him time to acclimatise to first grade without too much pressure on him.
Another one is Manly, also showing a large bias down the right this season, something we noted from their Las Vegas games. Again, same chart as before but limited to the Sea Eagles only. Keep in mind the Manly had the bye in Round 2 2023, so I’ve used their Round 3 data to ensure we’re getting similar comparisons.

Manly’s search for width isn’t surprising given the speed they possess in their back five, as well as having one of the most damaging edge forwards in the game. Anthony Seibold talked about unlocking his centres this season in a story on THIS MASTHEAD regarding union and league working together, stemming from his time in England with the 15 man code.
“The other one is, in league probably the last 30 years we have had left and right centres, but in union they don’t do that. So we are trying to find ways where we can unlock our centres [together] and unlock our halves, rather than keep them on the opposite side. That’s where we can get some takeaways from rugby as well.”
You can see how more right side play, especially in their own half, the Sea Eagles have had from their play the ball heat maps, with 2023 on the left and 2024 on the right.
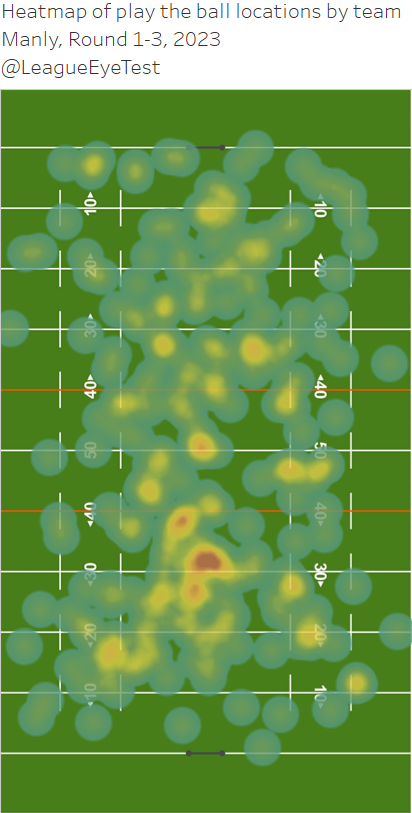
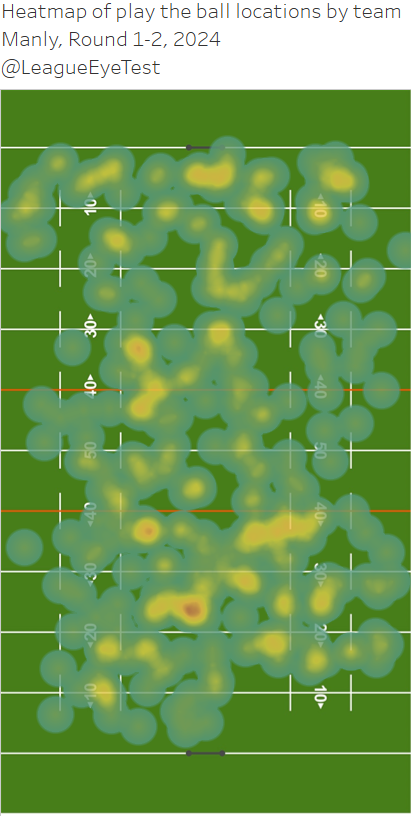
If you’re looking at unlocking your centres, pushing the ball wide early to take advantage of compact defensive lines is one way to do it. It won’t work forever, but until teams prepare for it the surprise factor will remain.
Next up there is Brisbane, who are pushing the left edge and tram tracks far more than they were twelve months ago, along with an increase on the right of the field.
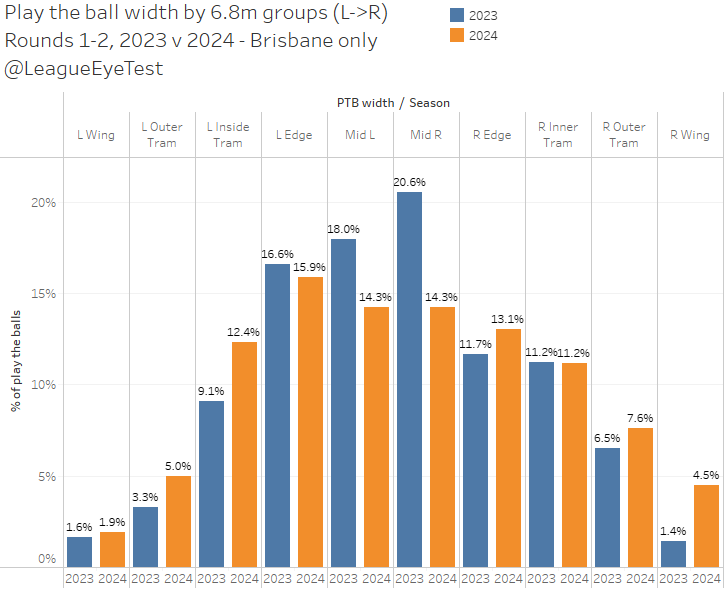
Looking at the Broncos specifically, friend of the site Mike Meehall Wood will hunt me down if I don’t mention the impact Lee Briers has had on the Broncos attack. If you had weapons like Reece Walsh, Selwyn Cobbo and Deine Mariner you’d be wanting to push the ball wider more often.
This next chart tells a story of their sets in 2024 and how it has changed from 2023. It shows the percentage of Brisbane’s play the balls outside of midfield (either tram track or wider) for the last two seasons.

The Broncos are starting their sets in a similar position across the field. On tackle 2 they’re pushing wider (usually to the left) more this year which you can see from the increase in the orange bar to 8.7% from 6.0% last year. On tackle three they’re pushing wider (usually to the right) more this year, before moving back the middle on tackle four. Then their last tackle option is increasingly wider. Watching their sets during a match should confirm some of this movement.
Then there are teams who haven’t mastered the concept of using width. The easiest way to show this is a chart of the percentage of play the balls through the middle of the field, comparing 2024 with 2023. The chart is ranked by 2024 results.
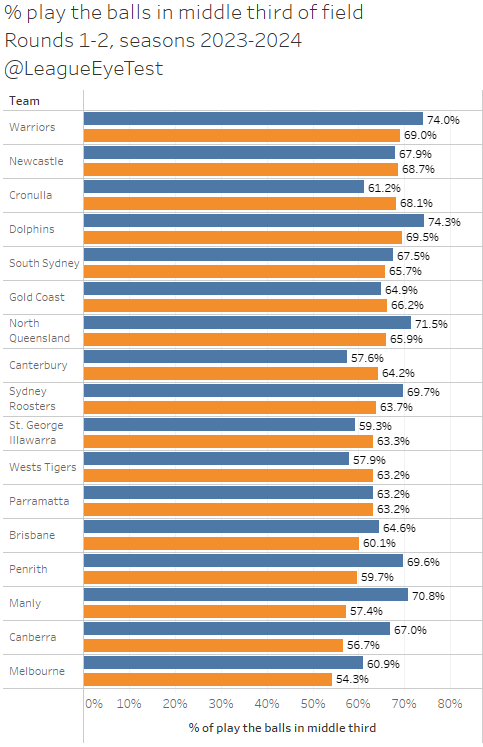
Manly, Canberra, Melbourne and Penrith are all under 60% of play the balls in the middle third this season, with Brisbane at 60.1%. All five have had at least a 5% drop in play the balls in that middle third as well. Manly’s change is the most dramatic, moving over 12% of play the balls from the middle to the outside, while Penrith and Canberra have also changed by double digits.
A few teams that have actually increased their percentage of play the balls in the middle third. Those are Canterbury, St George Illawarra, Wests Tigers, Gold Coast, Newcastle and Cronulla. Most of those teams have something unflattering in common, but the latter two are intriguing to me.
The change in Newcastle is possibly stemming from the loss of Dominic Young. Having Enari Tuala and Tom Jenkins in Young’s spot for the first two rounds, the Knights haven’t had the same combination of speed, power and finishing in that spot. Given that it would make sense they would veer away from that side of the field somewhat. I’d want to be getting the ball in Kalyn Ponga’s hand more often, and the middle of the field isn’t where I’d want that to be happening.
They did score two tries through the middle with Adam Elliott against the Cowboys. But that’s not the type of play that helped them progress to the second week of the finals in 2023, and it will be interesting to see if Adam O’Brien changes things up if the results don’t come their way.
The Sharks spot here is intriguing, as they have all the tools to play wider in a similar way to Brisbane. Yet they seem content with battling through the middle third, and are playing the ball there 7% more than one year ago. If it helps them against top four sides then the style doesn’t matter, but with a relatively easy draw over the next month that won’t become apparent for a while.
Here’s some more supporting evidence for the shift in width. Last week I mentioned that stats like line engagements, passes and runs were up year on year for halves. Line engagements specifically are up over 20 per game on the first two rounds of 2023, per Fox Sports Stats. There are over 72 line engagements on average per game this year, ahead of the 55 per game last season, and this year’s number is the highest in the past five seasons.
Where is this increase coming from? Pretty much across the board position wise. Below shows the percentage change in line engagements by starting position year over year.
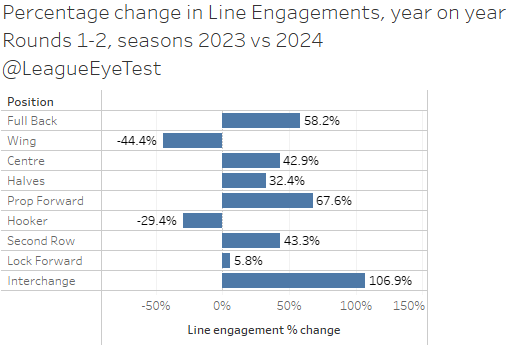
Aside from wingers and hookers, line engagements are in all other positions, mostly by double digits. Most of these positions are increasing off low bases though, so the increase looks more dramatic than it does – halves have at least six times more line engagements than any other position. The +67% for prop forwards looks large, but halves have 10x as many line engagements as front rowers. Which is why the 32% increase in line engagements for halves in the first two rounds matters.
Centres are also making 11% more runs than last year, second rowers up 7%, and wingers are up 5%. Prop forwards are down nearly 12% in runs completed, with interchange players making up some of that gap (+8%).
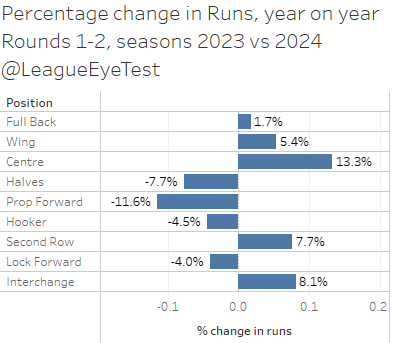
Again, centres had more runs this week than front rowers. Moses Suli had 16 runs this week, no Dragons forward or interchange player had more than 13 and there were only three in double figures. While not a centre Zac Lomax in the same game had 27 carries. Some of this corresponds to a drop in minutes from starting front rowers – down 11% year on year, with interchange minutes up 10%.
Props are also the only position with a drop in possessions (touches of the ball) this season, with all backline positions seeing a minimum of 6% more receipts, up to 12% for centres and fullbacks.
Hopefully it’s becoming clearer what has happened on field through two rounds. The change in width is coming from spine positions becoming involved earlier in tackle counts, with a number of teams pushing the ball wide early in tackle counts through their halves rather than concentrate on yardage up the middle. It’s not replacing middle
Next up I wanted to highlight a few expected point charts from the round. First up, Eels v Panthers.
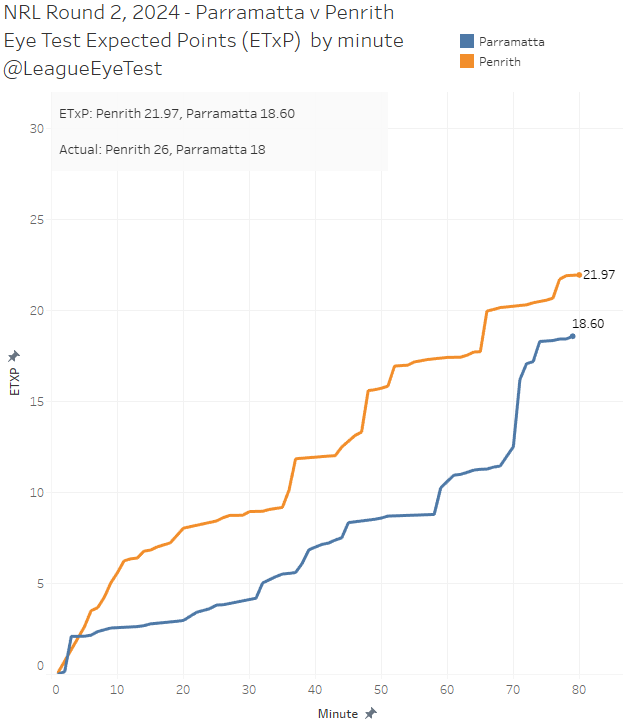
The Eels dominated a mountain of Panthers possession early and despite some high value field position late weren’t able to capitalise and didn’t add to their half time score of 18. The expected point totals at the end of the game ended up reasonably close.
In Canberra it was a similar story for the Wests Tigers to last year in their season opener.
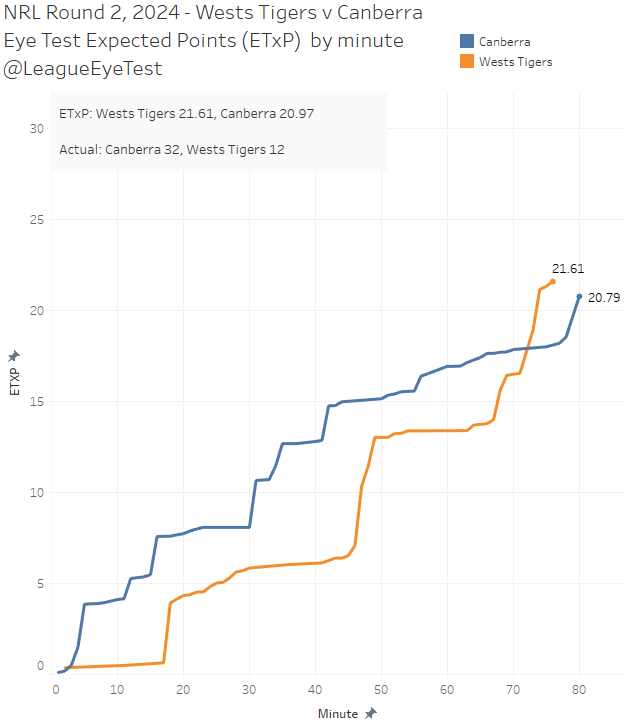
A mountain of second half possession (60% of territory) in areas that usually yield points, but not a point to show for it. They came out on top in expected points 21.61 to 20.79, but the 32-12 scoreline shows they not only failed to score themselves from good position, but they also let the Raiders over the line from areas that don’t usually allow points.
The Knights v Cowboys chart is not a pretty read for Newcastle fans.
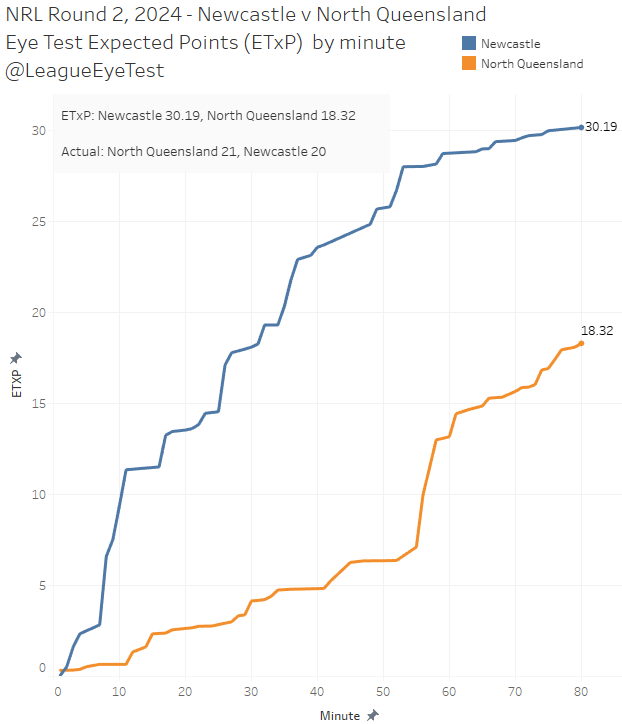
The visitors dominated field position in the first half and really should have led by more than 12-0. Newcastle’s expected point total from that half alone was 23.60, higher than either team’s 80 minute expected point total from the preceding game on Saturday. As the game progressed, they looked gassed and the Cowboys came home with a wet sail.
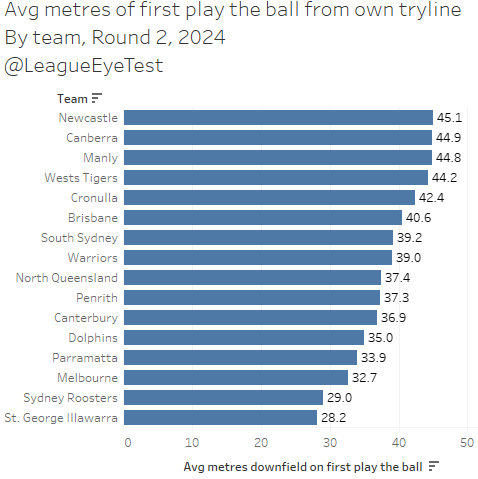
Newcastle had the best average tackle one play the ball position his week at 45.2 metres, another number emphasising how dominant they were with the ball.
Hopefully this result won’t come back to haunt the Knights late in the season if they’re jostling for a finals position.
It was a similar tale in the Manly v Sydney Roosters game, where the Sea Eagles had a stack of high quality possession in the second half but couldn’t put the Roosters away.
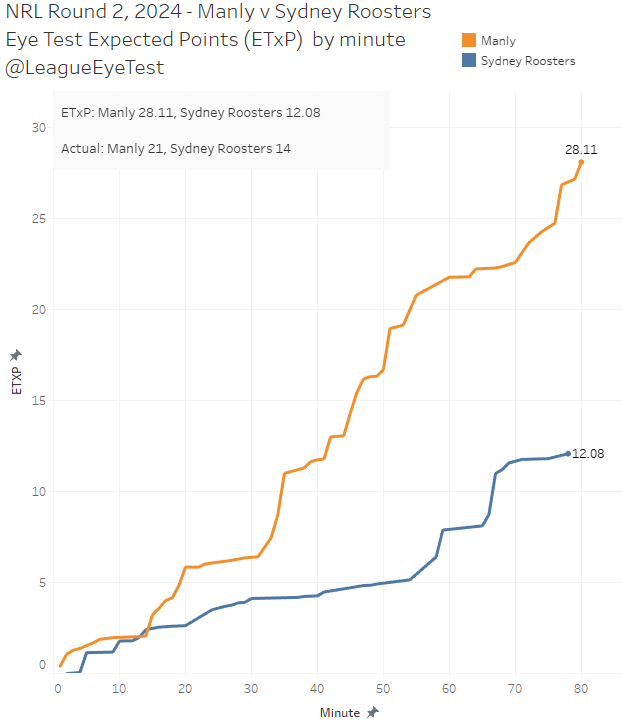
As seen in the chart above Manly played the ball on first tackles almost 45 metres downfield, and the Roosters just 29. It’s hard to consistently give away that sort of initial field position and come away victorious.
Moving on to Run Metres Over Expected/Run, first up we’ll examine the team performance.
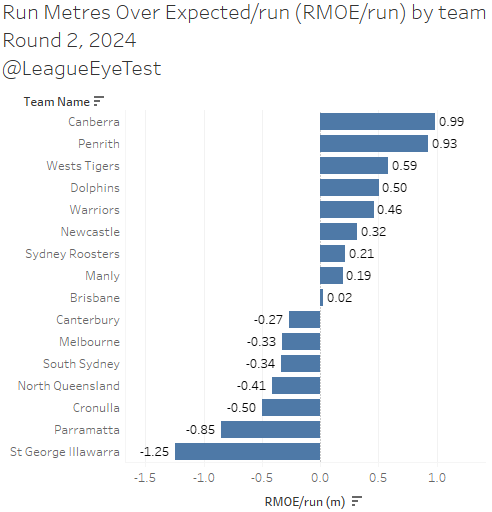
This week we did see some teams beat their expected metres totals, nine of them in fact. Brisbane barely counts though as they were +0.02 RMOE/run, which could come down to human error.
Canberra and Penrith led the way at +0.99 and +.93 RMEO/run, indicating they beat their expected run meters by at least 90 centimetres per run. Over the course of a set that can add up to almost 5 metres, which is a pretty decent chunk of extra yardage that an average team wouldn’t be gaining.
The Dragons and Eels look woeful under this metric. The Dragons were -1.2 RMOE/run, and struggled to make any yardage against the Dolphins, and only 34% of their runs were above expected. Combine that with their sets only starting 28 metres out as we noted earlier, and it was a long night for the red and white.
The Eels were still bad under this metric but better than last week at -0.85 RMOE/run and 40.6% of runs above expected. Penrith led the way in that stat this week at 59%, ahead of the Tigers at 56.6%, further emphasising how bad their execution in attacking areas was.
Now let’s check out the best performing players by RMOE/run, from a minimum of seven carries.
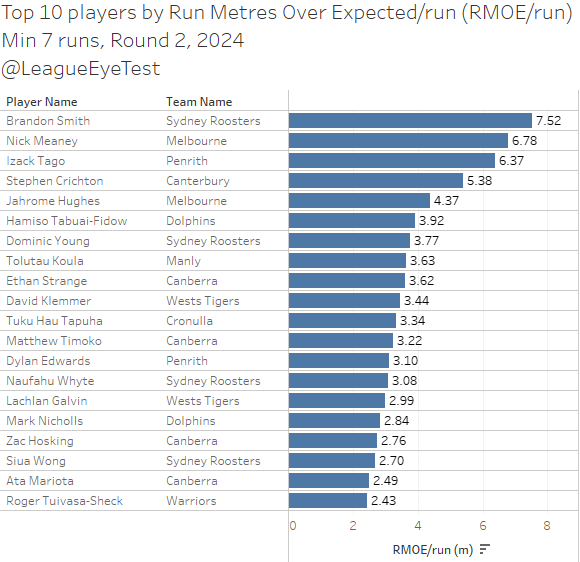
Brandon Smith first at +7.52 RMOE/run, ahead of Nick Meaney and Izack Tago. Raiders icon Matt Timoko could only muster 12th place this week, but Canberra fans will be happy to see Ethan Strange crack the top 10, and new favourite son Zac Hosking making the top 20. Debuting five eight Lachlan Galvin at +2.99 RMOE/run was one of the sole bright spots for Tigers opening game.
Lastly this week it’s the top and bottom performers by the site’s Eye Test Player Contribution Rating (ETPCR). First up, the top 20.
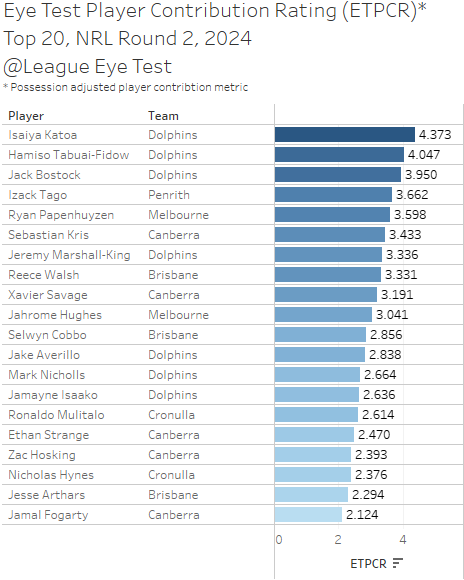
With their 38 point demolition of previous Round 1 (News Ltd) darlings the Dragons, the chart is dominated by Dolphins players. Isaiya Katoa placed first for the week with an ETPCR of +4.373, ahead of Hamiso Tabuai-Fidow, who earned his Dally M votes this week at +4.047. Rookie winger Jack Bostock rounded out the Fins trifecta in third place with +3.950.
Four other Dolphins placed in the top 20, including another round one absentee in Jake Averillo, who had an ETPCR of +2.838.
And here’s the bottom 20 players.
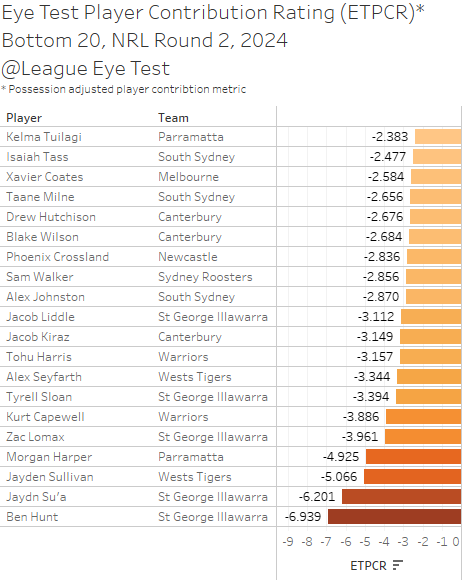
Dragons players abound here, with Ben Hunt (-6.939) and Jadyn Su’a (-6.201) with extremely low numbers from being tormented by the Dolphins left edge. Jayden Sullivan had an inauspicious start to his Tigers career, with an ETPCR of -5.066, but it feels wrong to single him out as there were substandard performances across the park in Benji Marshall’s debut.
Eels centre Morgan Harper went from the top 20 last round to the bottom 20 this week, which can always happen when you face the Dogs one week and Penrith the next. Given Izack Tago’s 4th position in the top 20 chart, it was clear one of the corresponding Eels edge players was going to suffer, and Harper was the victim.


