
Last season around this time I tried to “simulate” Dally M or Player of the Year voting, based purely on statistics. I used this site’s player impact metric the Eye Test Player Contribution Rating (ETPCR) to give out “votes” to the top three players from every game to see how it would look compared to the Dally M award.
This season I’m trying it again, and from the looks of the numbers it will be an incredibly tight race between James Tedesco and Jahrome Hughes. The Storm’s planned resting schedule might end up influencing the vote. Unsurprisingly Hughes is running away with the Storm Machine newsletter’s player of the year voting as well.
If you’re new to the site ETPCR is my overall player contribution or impact metric, which measures how much of a players statistics influenced a win or a loss. We take each players statistics for a match, and weight them based on how well (or poorly) they correlate with winning games, and also adjust them for minutes played and possession. The full explainer goes into more detail.
I keep saying it’s an impact metric, not a talent metric, and the players at the top aren’t always the “best” players. Usually, they are but it doesn’t always match the eye test, and quite often the quality of players around them can play a part.
As noted in the post last season, this method wasn’t anything new and friend of the site Liam of the Maroon Observer looked at it in 2021 on his previous incarnation. It’s still a fantastic read about the benefits and drawback of using different systems and which ones produce usable results.
I went for a slightly different approach than Liam. I tried to work within the Dally M or other Player of the Year voting where each match you give out 3-2-1 points or votes to three different players, based on their statistical contribution alone to each game, rather than the usual season averages that I post on social media. Then we tally them up just as you would from different real life voters and see who comes out on top.
In 2023, I tried three different methods to find something that looked “correct”, or as “correct” as picking the best player of the season can be when you’re not even defining “best” to start with.
Or “correct” without considering some of the votes that judges give to players who contributed very little. There was one instance this season where a player ranked around 264th out of 272 players by my ETPCR metric managed to get some Dally M votes.
There is also the issue with using it as a measure of the “best” player is that it will reward one really talented player on an average or bad team, since they monopolise all of the touches and are involved in most attacking structures. They also usually don’t have as many team mates to cannibalise votes either. It also benefits players who may have two brilliant games a month, but also two absolute stinkers, since we’re not voting on negative performances and my ETPCR metric (rightly) encompasses both sides of the game.
Regardless, the methods I used last season showed some promise, so I thought I’d try them out again. First up we’ll set a baseline for the best players by ETPCR for the whole season instead of per game. Below is the top 25 players from Rounds 1-25 this season, purely by average ETPCR with a threshold of 13 games played.

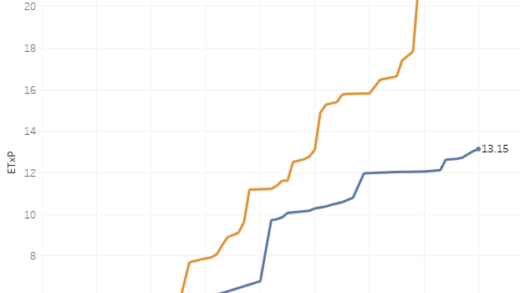
The top two players pass the standard eye test, Jahrome Hughes and James Tedesco have been two of the most consistent players all season. It feels likely that one of these two will end up with the award, especially considering the less than stellar last month the Panthers have played and Dylan Edwards position when voting went dark. If you look at their round by round numbers, you’ll understand why.
Both have been incredibly consistent, with Hughes only having one negative game this season (Round 12 against Manly). Tedesco has higher highs with multiple ETCPR games above 7, but also has five negative games including a season low -2.095 from Round 22 when the Chooks let the Dolphins score 34 points.
Third place to Reece Walsh seems a bit unlikely given how the Broncos have fared this season, but when you look a bit deeper at the numbers it’s not as outrageous as it first seems.


The Broncos are 10-12 overall, but are 50% (7-7) when Walsh plays, meaning they’re 3-5 without him this season. His round by round ETPCR is all over the place, he’s had some tremendous games (Rounds 12 & 23), some very good ones, but some where he was missing (rounds 3,6) or just bad (9,21).

That Round 9 performance was boosted by a try and a line break assist as well, with the Broncos letting in 40 points against the Roosters that night.
One other interesting note about this list is just how few of the best players in the competition have missed significant time this season. I’ve set the games played threshold at 13, meaning we’re already filtering out the likes of Nathan Cleary, Mitch Moses and Latrell Mitchell from this list.
To show just how many games the best players in the competition are missing, last year in the top 25 players by ETPCR to Round 23, 17 of them had played at least 20 games. This year, just seven players of the top 25 have played at least 20 games up to Round 25. Those seven are James Tedesco, Daly Cherry-Evans, Daniel Tupou, Matt Burton, Sam Walker, Jacob Kiraz and Eli Katoa.
Dogs fans will notice not only Matt Burton, Jacob Kiraz and Josh Addo-Carr in this list, but also fullback Connor Tracey. I’ll have a bit more to say about Tracey’s season later in this post.
Additionally last season there were eight players who received votes or points in at least ten games. This year there are just four, showing how the upper echelon of players hasn’t been available or performing at a level from prior seasons.
Now we’ve established who the best players have been on averages, which already with Walsh highlights the issues with using this method. Plus he’s only played 14 games. Next we’ll try simulating a standard 3-2-1 Player of the Year on the top three players by ETPCR for each game this season. Below are the top 25 players by this method.

The top of this list isn’t dramatically different from the average list, with Tedesco and Hughes still taking the first two spots, with Tom Trbojevic jumping from 4th to 3rd as Walsh drops to 6th and Matt Burton moving from 13th to 4th. Latrell Mitchell shows up as well, as we’re tallying individual game voting and there’s no games played threshold.
Scott Drinkwater appears in this list as well, since we’re only voting on positive results and his ETPCR scores are littered with terrible games where the Cowboys leaked significant points. If you look at his round by round performances you can see it’s either very good or very bad.

Still he managed to nab 20 votes from those positive games, which relates back to my comment previously about inconsistent players faring well with this method because the negative games don’t attract any penalty.
You might also notice that every player in this top 25 is a back. Like last season, the issue using ETCPR (or a similar metric) for this sort of voting is linked to the type of statistics that correlate with wins or big margins. Tries and line breaks, and assists of each, correlate highly with winning and bigger margins, and the majority of those statistics are accumulated or created by backs and halves.
Run metres also correlate well with winning, which helps out forwards, but they don’t share the same value as creating a try or assisting one. This isn’t necessarily a negative when trying to mimic Dally M voting, since only a handful of forwards have won the award in the NRL era. And the way the NRL has evolved into a style of game favouring early shifts, switching of attack points and fast or mobile edges, that isn’t unsurprising.
To try to combat the backs heavy lists, the second method I tried last year was 3-2-1 for each game, but having separate 3-2-1 votes for backs and forwards. This is more in line with the Dally M as you have technically two voters giving a total of six votes. But they’re to six different players whereas the Dally M can have two voters giving 3 points each to the same players.
It did tend to over index on forwards as the best forward was receiving three votes, when they may have been the 7th or 8th best player statistically in those games. Here’s the results for 2024.

We still have the same top two players in Hughes and Tedesco, but Addin-Fonua Blake crashes in at third place, with 27 points. Still, he was absent from the overall 3-2-1 list, showing how hard it is for a forward to be in the top three players for a game. He may not have been the top three players by ETPCR, but 13 times out of his 22 games this season he was one of the best three forwards on the park by the same metric.
This does give a better distribution of backs and forwards again, and I don’t think there’s a forward on this list that anyone would say hasn’t played well at times this season. Again, we’re only voting on positive performances, not negative ones, so rocks and diamonds players will probably be over represented than they would be by a season average of a catch all rating based on stats.
Next was doing a 3-3-2-2-1-1 voting structure for all players, basically taking the best three backs and best three forwards and re-ranking them from 1 to 6. This method has the same issue as the previous one in that you end up with six different vote getters, but you don’t over index on forwards.

No change at the top, it’s very similar to the standard 3-2, and we end up with only one forward in the list (Fonua-Blake). Positions 25-50 have a heavy weighting of forwards, with the likes of Haumole Olakau’atu, James Fisher-Harris, Isaah Yeo, Harry Grant and Angus Crichton sitting in this range. This indicates to me it’s more of a style of play issue that I alluded to previously than a problem with methodology.
I did also try a 6-5-4-3-2-1 method which wasn’t that different from the 3-2-1 system, but it just stretched out the gaps between each player, which you can see below.

By every method I’ve tried, it’s either Tedesco or Hughes that should win the Dally M this season, although Hughes had only half as many Dally M votes as Dylan Edwards when voting went dark earlier this season. That’s a large margin to run down but both Hughes and Tedesco have had stronger second halves of the season than Edwards, who hasn’t played recently. And Kalyn Ponga showed last year you only need have one good half of a season to win the award.
By ETPCR season average, Edwards ranks 9th and on a standard 3-2-1 voting based on ETPCR he’d be ranked 10th, meaning my metrics weight Hughes and Tedesco’s performances higher than Edwards.
These results work even if they aren’t perfect, and it’s an interesting way cast another lens on which players have been performing at a high level this season.
Ideally, I wanted to do a combined vote between myself and Liam, using his TPR data for each game. But for the second year in a row, I completely forgot to ask him about it until after I’d started writing this so we’ll have to wait to 2025 to see if either of us can be bothered continuing doing this sort of thing for little return. Just like the Eels, there’s always next year, right?
There’s the usual caveats that simulating a vote based on statistics only captures quantifiable production, and anyone who’s watched a game of rugby league knows there’s far more things that happen on field that aren’t currently (or publicly) tracked. It’s not only what a player produces, but when they produce it and what sort of adversity they overcome that should be considered.
To get around this, one thing I wanted to try this season is looking at a what a stats plus vibes method might look like. My idea was to use the system I think produces the best result, the ABC’s Grandstand Player of the Year voting in combination with my own ETPCR method of simulating voting. That way we’d have the quantifiable production side of voting covered, as well as a more traditional approach based on a whole of game performance rather than the sum of it’s parts.
Sadly, I could only find the first 21 rounds of ABC POTY voting available on the ABC site, so it’s not a complete list, but still gives us enough to work with. Here’s how combining the top three players from each match by a 3-2-1 vote by ETPCR up to Round 25 and the ABC 3-2-1 POTY voting up to Round 21 would look.

There’s not a dramatic change in voting here, but the overall list has a better representation of forwards and. Some notable variances include Dylan Edwards, who always polls well in traditional voting, moving into the top five. Reece Walsh also drops down slightly as he didn’t receive many ABC votes, while Brian To’o has the biggest difference between the two methods – 18 by ETPCR but just 2 from the ABC.
Keaon Koloamatagi is the biggest beneficiary here, with 18 votes in the ABC polling up to Round 21, compared to just 4 by my ETPCR method.
And in 25th position here is Connor Tracey, who I’ll now delve into in more detail. The Dogs fullback may have been one of the sneakiest best buys of the season. Not only does he rank 20th for the season by ETPCR above, but his numbers at fullback are significantly better than on the wing.
The 14 games he has played at fullback produced an ETPCR of +1.172, which would push his rank up from 20th to 15th best this season among players with at least 13 appearances. His four matches on the wing resulted in an ETPCR of just +0.423, which would have ranked 70th of players with 13+ games.

Not only that, but Canterbury’s record with Tracey in the #1 position this season is 10-4, and they were 2-2 with him on the wing before Blake Taafe (rightly) made way for him. Overall the club is 4-4 when he isn’t playing at the back (2-2 when he plays on the wing, and 2-2 when he doesn’t take the field).
That isn’t to say the Tracey is the sole reason for the Dogs incredible performances this season, including a league leading defense that I noted had improved dramatically in April. But clearly pushing him to full back has helped unlock some of their attack, and he’s been far more steady in defense than Taaffee had been during the opening month of the season.
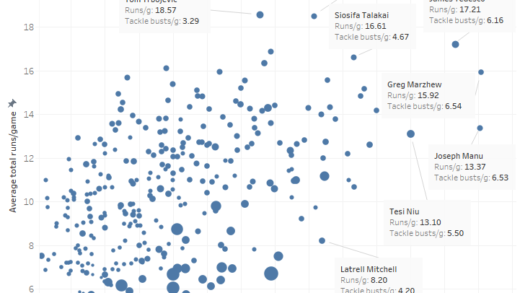
If we compare his percentile ranks for regular and advanced metrics with Dylan Edwards, there isn’t a lot between them statistically outside of Edwards faring better in metres per run, expected metres and tackle breaks. Below is each players percentile ranks for regular per game stats and then advanced metrics.

Tracey outranks Edwards in three areas – overall negative play (conceding penalties, set restarts or errors) where he is in the 68th percentile to Edwards 58th, Ball Runner % (how often he runs the ball) at 86th percentile to Edwards 62nd, and Decoy/Support % (how often he runs a decoy or support line) at 72% to Edwards 63%.

This isn’t to say that Tracey is having the same impact as Edwards, or is as valuable as him, just that his statistical profile and appears somewhat similar as a work rate fullback. Coach Cameron Ciraldo mentioned his strength in returning the ball earlier this season, something Edwards also excels at.
“Every time the ball goes up, he just looked comfortable under the high ball,” he said.
“He brings the ball back with plenty of purpose and gets our sets started.”
Tracey’s value to the team is well known by Bulldogs fans, but it’s his higher profile team mates like Burton, Kiraz, Stephen Crichton, Reed Mahoney and Viliame Kikua that are usually mentioned in the media first. My point Tracey is equally deserving of similar praise and should be mentioned in the same group.
1 Response
[…] scrutiny has undoubtedly been fuelled by the datafication of sport and its athletes, which has seen player performance statistics enter the sporting […]